Jason M. Barr April 10, 2018
Imagine it’s the dead of winter and you’ve just come home from work. Your house is chilly and so you move to the thermostat to crank up the heat. But, just as your hand is about to turn the dial, you think, “Wait! If I heat my house, I will put additional CO2 into the atmosphere, which will increase the probability that the good people of the Solomon Islands will be harmed by sea level rise. Therefore, I’ll keep the heat down!”
If I had to guess, very few of us have done this. But, the truth is, carbon dioxide is the mother of all externalities. Most of us go through life thinking about the things we need to do for ourselves—work, play, sleep, socialize, etc.—with little thought that we are producing an odorless, invisible gas which is destabilizing the earth’s climate and driving up sea levels. We think about climate change in the abstract, but have little direct incentive to alter our behavior.
The Sources of CO2 Emissions
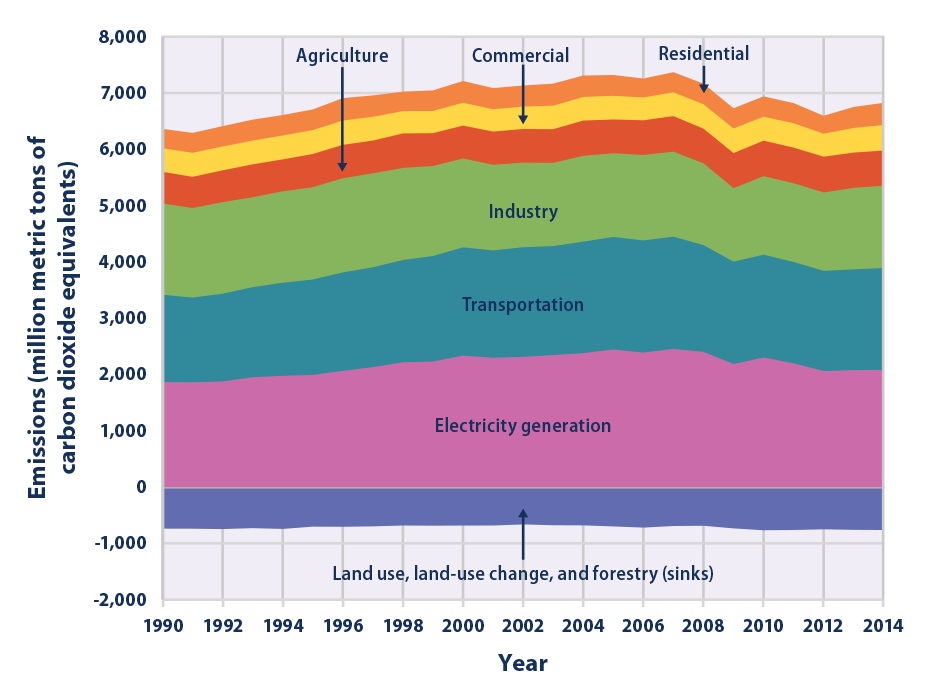
Figure 1 shows that the largest sources of CO2 emissions in the U.S. comes from the production of energy and the transportation sector. Imagine we had a fleet of electric vehicles that were charged from a grid distributing purely green energy; this would eliminate nearly half of all the CO2 produced in this country.
However, looking at the totals over time doesn’t tell the complete story. It also turns out that where you live can determine how you contribute to climate change.

The Spatial Dimension
An interesting study entitled, “Spatial Distribution of U.S. Household Carbon Footprints Reveals Suburbanization Undermines Greenhouse Gas Benefits of Urban Population Density” (2013) by Christopher Jones and Daniel Kammen demonstrates the spatial nature of greenhouse gas emissions. (I tell my students they need to read the paper, but the title pretty much sums it up.)
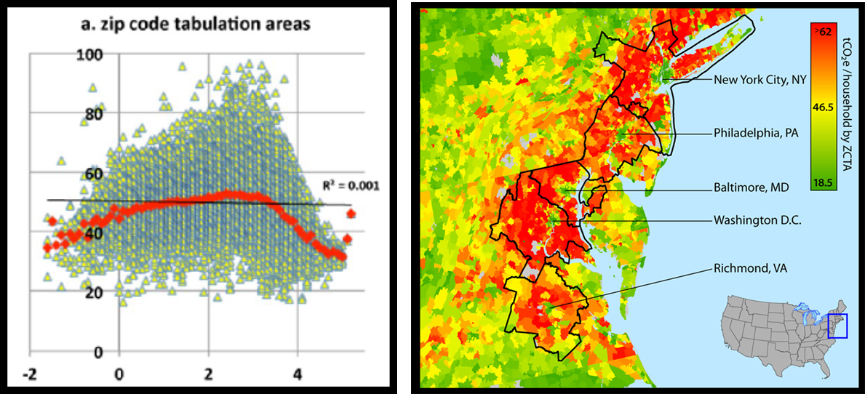
For each zip code in the United States, the authors estimate average household carbon emissions. Figure 2 reports their findings. The left graph shows the relationship between population density (on log10 scale) in a zip code and the average household footprint.
The key takeaway messages from this graph are, first, that there is a lot of variation across zip codes. Some households emit 100 metric tons, while others are closer to 20. The average household in the United States produces about 55 metric tons of CO2 per year. Note that the Statue of Liberty weighs 205 metric tons; thus, the typical household emits the weight of Lady Liberty nearly every four years.
Secondly, the red diamonds show a pattern between population density and CO2 emissions, on average. In rural areas with low density, emissions are small. But as density increases—as we move from rural to suburban—emissions increase; then they peak, and, after that increased urban density is associated with lower CO2 emissions.
The right panel of Figure 2 shows this for the Eastern Seaboard from Richmond, Virginia to southern Connecticut. Those areas that are green–the dense urban areas–have emissions below the average. Those in red—the surrounding suburbs—are above.

Explaining the Variation
Why are central cities so much greener than their suburbs? Jones and Kammen perform a statistical (regression) analysis that aims to explain why some zip codes have high emissions and others low.
The main result is that most of the average household emissions per zip code can be explained by a handful of variables, including: (1) the number of cars, (2) the size of houses, (3) the average income, and (5) the population density.
In short, more cars, larger houses, and higher incomes lead to greater carbon footprints, while greater density, all else equal, leads to a lower one. Suburbs are the places with the most driving and the largest houses; while central cities are less reliant on automobiles and have more public transportation. And, by living more densely, people are able to do the things they need to do while emitting less CO2. (The role of skyscrapers in CO2 production is more complicated and will be discussed in a future post.)
The Policy Implications
The solutions to fixing the CO2 emissions problem are straightforward. The technology for clean energy exists and is becoming cheaper by the day. Furthermore, the economic policies are also clear in that we need to implement a series of taxes and subsidies to change behavior. But, alas, politics remains the blocking point.
Jones and Kammen’s research (and a similar study by Edward Glaeser and Matthew Kahn in 2010) suggest the economic policies that will turn the tide. Regarding cars, we need to make gasoline-based driving much more expensive, increase fuel efficiency standards, and subsidize cleaner fuel sources. For homes, we need to encourage denser living by relaxing zoning codes to promote subdivision of homes, suburban infill, taller buildings, rental housing, and mixed-used neighborhoods.
But, given the current political climate at both the local and national levels, the idea of increasing taxes on driving is, sadly, laughable. In New York City, for example, a plan to implement congestion pricing in Manhattan was, once again, put on the table and then quickly taken off after protests. Changing zoning rules is greeted with shouts of “Not in my backyard!”
At the federal level, the Trump administration is doing its best to add more greenhouse gases to the environment. Last year, Trump withdrew the U.S. from the Paris Agreement on climate change mitigation; now he is planning to undo car fuel efficiency standards. All the while, members of the Republican Party are closing their eyes and ears to climate change, as if denying the problem will simply make it go away.
A Simple Proposal: Household “Cap and Trade”
Cap and Trade
Cap and trade programs are increasingly used in industrial sectors to limit pollution emissions (not just CO2). The idea is that the government calculates the total emissions of a particular pollutant being emitted each year and then creates the cap—the maximum quantity of allowable pollution.
Then the government issues pollution permits to each of the companies in the industry—where the total number of permits adds up to the cap. Those firms that do not have enough permits have to buy them from the efficient firms who have more permits than they need. In this way, the heavy polluters pay for their pollution, while the low emitters are rewarded. Over time, the inefficient plants will be shut down or modified, and/or more efficient plants are constructed. The cap can then be reduced.
Household Cap and “Trade”
My proposal is to use this idea but at the residential level (and could easily be extended to commercial real estate). Every residence needs electricity and temperature control systems (heating and/or cooling). Electricity is normally purchased from a local utility, such as ConEd in New York, or PSEG in northern New Jersey., and can be generated by any number of carbon-based or carbon-free means, such as from natural gas, coal, wind, solar, geothermal, or hydroelectric.
Heating, if not created by electricity, comes either from natural gas piped into the house or from the purchase of heating oil stored in tanks on the property. Thus it’s quite easy to know how much energy and fuel each structure is using and how much CO2 is being produced as a result.
Each state would need to set its policies, ideally in coordination with surrounding states. But the local utility would be responsible for administering the program. Let’s say each utility initially sets an emissions benchmark based on the average household CO2 emissions in its service area.
Each month when the household gets its bill, it can see how much CO2 it produced (heating oil providers would need to send this information to the utility). Then those above the average are taxed for the CO2 emissions, while those below receive a credit. The tax and credit rates can becoming increasingly large the further one is away from the average. (Note that Glaeser and Kahn (2010) assume, based on research, that the estimated externality cost per household is about $50 per metric ton).
Just as importantly, the bill would promote possible means for property owners to reduce their carbon taxes (or increase their credits), such as through the purchasing of green energy from the utility, the installation of solar panels, or increased housing insulation.
The key point is that wealthy suburbanites with large, inefficient houses will be more heavily penalized for their externalities; while the efficient houses or those living densely will be rewarded. It will encourage the heavy emitters to reduce their footprints or pay for their harm. And, after, say two years, the “cap” can be lowered to incentivize further reductions.
The Bill of Sale
While this plan will not likely lead to the wholesale realignment of land use or density throughout urban areas, it would be a start toward making people pay for the cost of their actions—and can be done in a way that is, relatively speaking, politically palatable.
Devastating Hurricanes like Katrina, Sandy, and Harvey come and go, and we quickly forget about the destruction. But a bill sent every month telling you how you are contributing to climate change should help make a difference.
[…] In the heart of Manhattan and the Bronx, greenhouse gas production per person is low, but steadily rises as you travel outward into the suburbs, peaking in the wealthy suburb of Chappaqua (there’s a dip in White Plains, a small city 20 miles north of midtown). After that, the towns are more rural in character and less likely to be in the zone of influence of New York City. In short, urban density is good for lowering emissions (and households in the suburbs should pay for their harm). […]