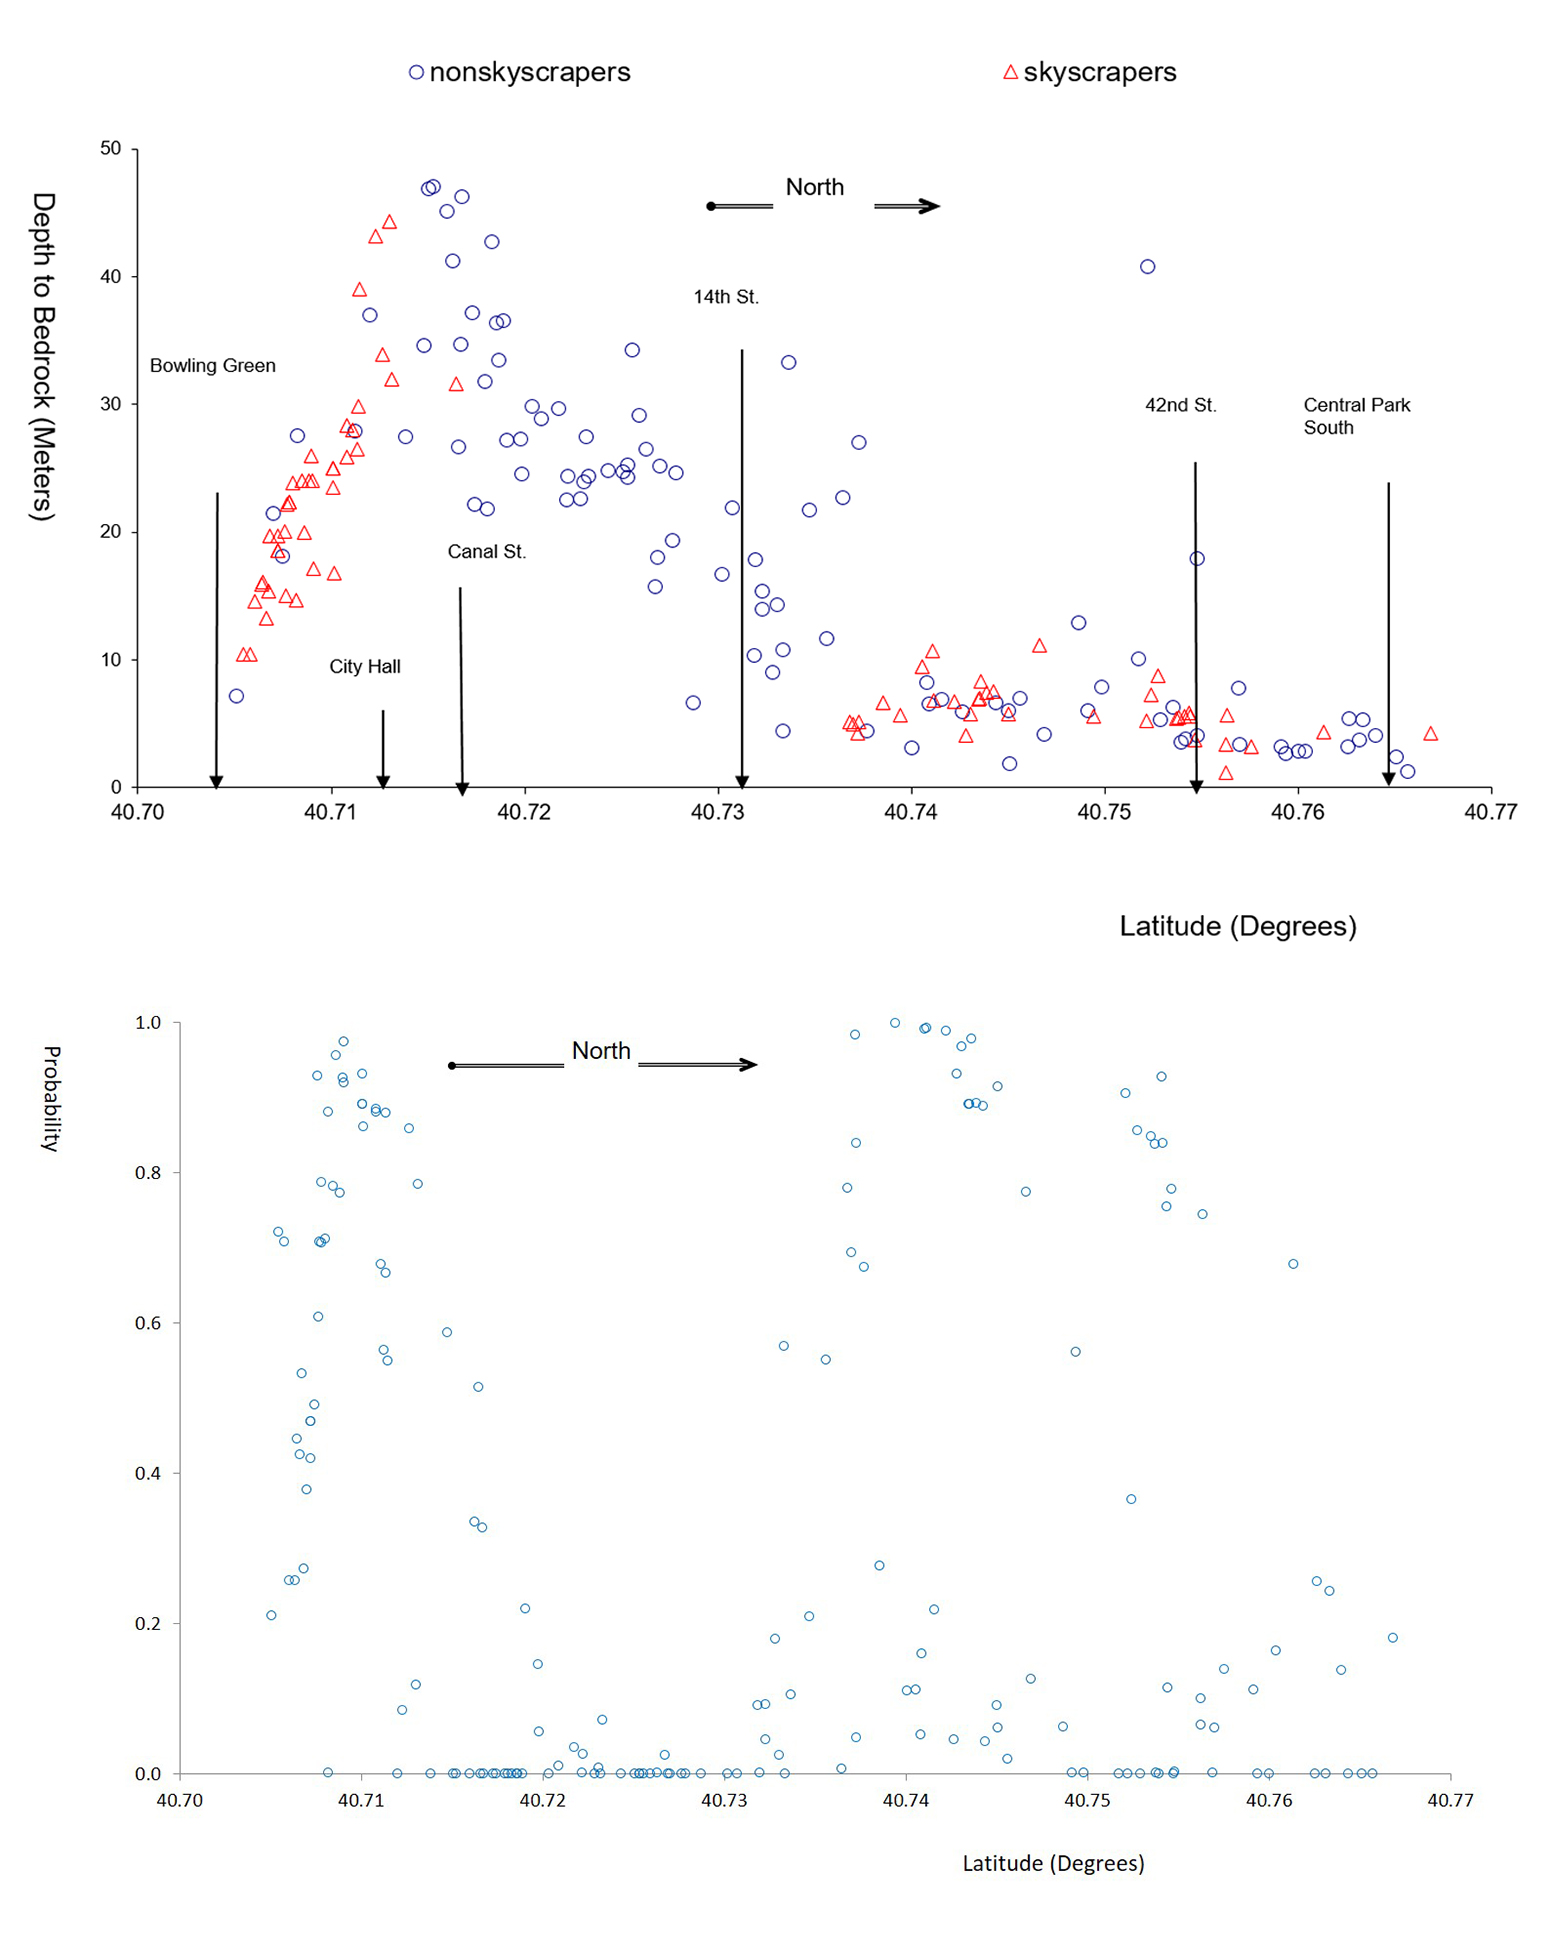
Figure: Buildings and Bedrock.
For the top graph, the horizontal axis represents the degrees latitude of Manhattan starting at the southern tip and going north to 59th Street. On the vertical axis is the depth to bedrock (in feet) relative to the street level. Each triangle is the location of a particular skyscraper that was constructed in the period 1890 to 1915. Thus we can see how far down the bedrock lies below each one. The circles show the bedrock depths for 99 randomly chosen lots that do not have skyscrapers. The hump-shape in the figure illustrates the location of the bedrock valley, which reaches its nadir near Canal Street and the Bowery. North of 14th Street, the bedrock lies relatively close to the surface. The figure shows that some skyscrapers, most notably the Woolworth Building (1913) and the Municipal Building (1914), were constructed over some of the deepest bedrock in the city. It illustrates that bedrock depths did not present a barrier to skyscraper construction.
The bottom figure shows the predicted probabilities of a skyscraper appearing at a given location going from south to north based on a statistical analysis, and with the assumption that bedrock depths did not vary across the city. The results show the skyscraper “deadzone” appears anyway. The reason is because the area between City Hall and 14th Street were the immigrant and industrial neighborhoods, and there was little demand for tall buildings there. Source: Barr, Tassier and Tredafilov (2010).
Leave a Reply