Jason M. Barr December 14, 2023
The Birth of Economics
Roughly speaking, the century from 1870 to 1970 can be called the Utopia-Was-Possible Century. By 1870, national incomes began rising faster than their populations; thus, economic growth was a fact of everyday life.
This improvement in our material lives was created by the switch to industrial-wage-based manufacturing, technological improvements and economics of scale, cheap fossil fuel-based energy, and the rise of global trade and finance.
The “fixed-pie-economics” of empire and mercantilism, where one nation gained at the expense of another, was now in its twilight, in the sense that economic growth through trade and mass production was to become the norm.
However, in the early years, all was not right in the Factory. Industrialization and trade produced a surfeit of darker sides. Workers toiled in miserable conditions for little pay; the urban air was darkened by thick clouds of smoke from burning coal; and the new technologies, like machine guns, could be used to unleash previously unimaginable waves of death to citizens and enemies alike.

The Dream of Utopia
From this era of promise and peril emerged a stew of ideas on how humanity could use its growing wealth to create paradise on Earth. Some nations took the socialist route and abolished private property, while others embraced market systems with varying degrees of government involvement.
By 1950, humanity developed a consensus that democratic capitalism, global trade, and a relatively benign global hegemon—the United States—would produce the most peace, the fairest allocation of resources, and, just as importantly, the greatest wealth of nations.
Though the Soviet Union and Communist China became immense forces, their experiences quickly revealed that they did not, in fact, hold the secret to utopia. The USSR became a totalitarian state, while Chairman Mao’s Great Leap Forward resulted in millions of deaths by starvation, and the Great Proletarian Cultural Revolution turned the citizenry against itself. By the end of the 20th century, these socialist states had simply withered away.
The Failure of Our Utopian Future
And here we are in the 21st century, some 150 years after humanity realized how to generate meaningful economic growth, but the promise of paradise never materialized. Today, the idea of utopia seems a distant, laughable dream. Rather, existential threats—economic, environmental, and political—hover above us like a cloud of killer bees.
Is Humanity Getting Happier?
Our failure to solve our economic problems is demonstrated by our life satisfaction. Since 2012, the United Nations (UN) has produced the World Happiness Report, which gives the average level of life satisfaction for each country’s residents, measured by asking people to rank on a scale of 1 (lowest) to 10 (highest) how satisfied they are with their life in general. A large body of research has demonstrated that the answer to this question is a useful predictor of the quality of our lives.
Across the Globe
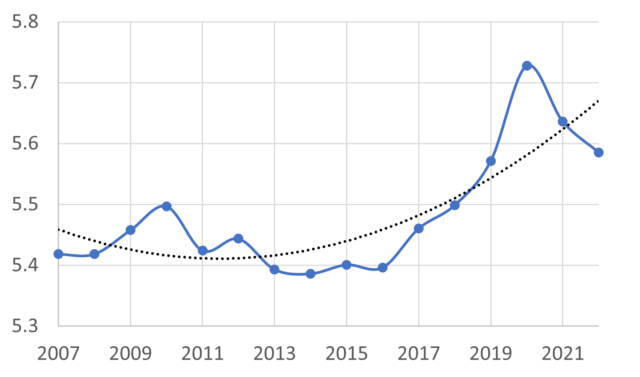
Across the globe, humanity actually seems to be getting happier (the COVID-19 pandemic notwithstanding). Average national happiness can be seen from the figure below, which gives the average life-satisfaction levels of over 100 nations around the world since 2007.[1]
Happiness was rising as the global economy in the 2000s was improving, and then the Global Financial Crisis put the brakes on things. But then, between 2016 and 2020, global happiness shot up. COVID-19 came along and misery ensued. Despite this, global life satisfaction will likely resume its upward trajectory when the aftermath of the pandemic dissipates.

The Correlates of Happiness
When we look at the global averages since 2007, they range from just below 5.4 to slightly above 5.7. Developed countries typically score closer to 7, suggesting room for improvement for the developing world. But global happiness’s rise and fall begs the question: What makes us happy?
The UN report focuses on six correlates of happiness. First is real per capita GDP, which measures a nation’s income level. Second is the degree of social support, which is measured as the national average of the response to the (yes or no) survey question: “If you were in trouble, do you have relatives or friends you can count on to help you whenever you need them, or not?”
The third element is a nation’s life expectancy at birth, which indicates health and healthcare quality. Next is the perception of residents’ freedom to make life choices, measured as the average of the response to the (yes or no) question, “Are you satisfied or dissatisfied with your freedom to choose what you do with your life?” After that is the measurement of generosity, measured by a country’s relative charitable giving rate. Finally, is the perception of corruption based on the average response to the (yes or no) question, “Is corruption widespread in your country?”
In short, these correlates look at income, the quality of people’s social experiences, their health, and their feelings of trust.
The Income Effect
Using their measures of the “inputs” to happiness, I find that GDP is the most important predictor of well-being around the globe (data and analyses are here). This makes sense as income—and the goods and services it buys—is first and foremost for survival. When a nation lifts itself out of poverty, its residents no longer worry about finding their next meal or a place to live.
And, around the world, income has been rising. In fact, between 2000 and 2022, Planet Earth’s real per capita GDP has risen by 43%. Many countries, such as China, Lithuania, Ivory Coast, and Uruguay, are developing rapidly, and their quality of life is improving (India’s happiness, however, has been falling from already low levels). To the extent that rising national incomes are channeled towards better health care, improved educational systems, and more life opportunities, the better people’s lives will be.
A simple measure of life quality is the so-called Human Development Index (HDI), compiled by the UN, which is based on life expectancy at birth, average educational levels, and per capita gross national income. We can see a strong relationship between a nation’s happiness and how it scores on the HDI. Though a strong predictor, it’s not 100%. Other factors are clearly at work.

Anxiety in the Developed World
Each year, when the UN Happiness Report is released, the press focuses on the “Happiest Country on Earth.” Usually, the top one is from the Nordic zone, with Finland winning the prize in the last five years. But little attention is paid to the trends—what’s happening over time? In 2012, 2013, and 2016, Denmark was the happiest country in the world. But its happiness level has dropped in the last decade. Finland has done something right, allowing it to take the top slot. But if Denmark’s experience is any guide, being king of the hill may be unstable.
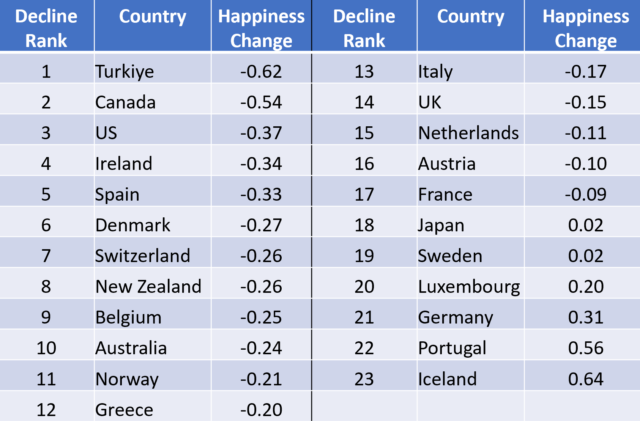
More broadly, what’s happening in the developed world? For simplicity, I focus on what I call the OECD+ countries—a group of 23 nations that represents the developed world (the original 20 Organization for Economic Co-operation and Development (OECD) countries plus three more, Australia, Japan, and New Zealand), which include the Anglo countries of North America and Oceania, Western Europe (including Türkiye), and Japan.
The data strongly suggest that once a country hits a certain wealth threshold, its overall well-being stays flat and often declines. Additionally, responsiveness to the happiness inputs generally falls. That is to say, rises in income and social support seem to matter less—or not at all—for increasing happiness.
The Delta
Looking at the changes from 2009 to 2019, we see that 17 of 23 of this group saw their happiness decline, while two were flat, and only three saw measurable rises. What drove these countries to reduce their life satisfaction? It’s not income. All these countries experienced net income growth (despite the Global Financial Crisis), and it wasn’t because of health and life expectancy, which also improved.
Instead, many of these countries experienced a drop in social support and generosity measures. Retrenchments along the social dimension appear to be driving the decline in happiness.

The United States
Telescoping onto the United States can shed more light on what’s happening with happiness in the developed world. If there’s one country where life should be improving, it’s the United States, with low unemployment and relatively rapid economic growth. Nonetheless, one fact stands out: American happiness has declined in the 21st century.
We can take a longer-run perspective thanks to data collected since the early 1970s from the University of Chicago’s National Opinion Research Center (NORC), which conducts its General Social Survey (GSS). Since 1972, the GSS has regularly asked people, “Taken all together, how would you say things are these days—would you say that you are very happy, pretty happy, or not too happy?” From this, we can create an index of average happiness (with 3 = very happy, 2 = pretty happy, and 1= not too happy).
The index reveals that American happiness peaked before the new millennium. The 21st century has been sad and grumpy so far. I don’t want to overstate the case. In the World Happiness Report, the U.S. typically lists around 15th in the rankings—with averages typically around 7 out of 10. Nonetheless, the data suggest that America is losing the happiness battle.

The Happiness Paradox
Part of the problem, in most developed countries, is that increases in income fails to cure our happiness blues. In 1974, economics professor Richard Easterlin discovered something about income and happiness. After a nation grows its economy to a certain level, there’s little apparent relationship between GDP and happiness. We can see this in the United States. Since 1972, real GDP (in $2017) per person has grown from $27,500 to $65,400, or 137%, while happiness levels have declined.
The reason for this lack of relationship is that what makes people happier within a nation is not their absolute income but rather their relative income. Most people compare their income level to those of their neighbors and social groups. And when their income is lower than the typical comparator, they feel worse.
The problem from a societal view is that the ranking is a zero-sum game. When one person rises in the rankings, someone else falls—thus, they switch happiness levels, and the total societal happiness level doesn’t change.
Another way to put this is that we can’t rely on economic growth to stimulate our happiness. Rather, we need rising incomes to ensure we don’t lose happiness (through unemployment or lower wages). In this sense, economic growth is a treadmill. If it stops, we fall off the machine. Otherwise, we keep running in place.
And just as important, we cannot use economic growth to only allow for greater consumption. Instead, some of the additional income needs to be employed for things that truly make us happy: healthier lives, higher quality social interactions, and fewer anxieties about life’s vagaries.
Why Did America Lose its Happiness Mojo?
Using the GSS data sets, we can make some inferences by looking at the statistical correlates of happiness. However, we first need to control for individual-level characteristics (via regression analysis, with results here). For example, the very young and very old tend to be happier than their overworked middle-aged counterparts. The rich tend to be happier than the poor. Those with higher educational obtainment tend to be happier than those with fewer years of schooling. Employed people tend to be happier than the unemployed, and so on. This exercise shows that happiness has been declining even after controlling for personal characteristics. So, the drop is not a statistical artifact due to sampling issues.

Drop in Trust
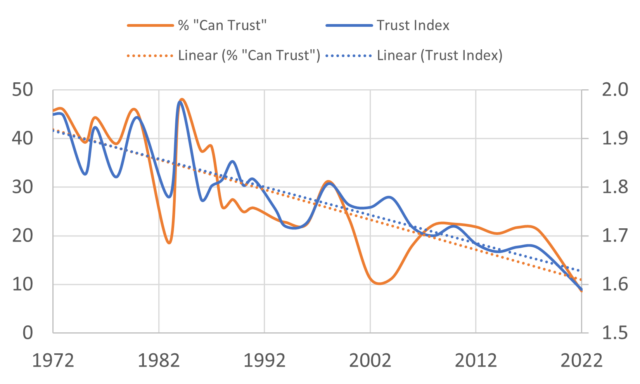
Let’s turn to trust. Since 1972, the survey has asked people, “Generally speaking, would you say that most people can be trusted or that you can’t be too careful in dealing with people?” The responses can be used to gauge national trust levels.
A large body of literature shows that social trust is a key component of happiness. If people trust their neighbors and their government, they will suffer less anxiety. They will have less fear of being ripped off and more comfort that the government will step in to provide needed services. And they will also be more socially engaged.
However, the response to the trust question has been worsening in the United States. In the 1970s, 40% of respondents typically said they can trust people. By 2018, it was down to about 21% (with shocking drop during COVID).
Including the trust variable in statistical (regression) analysis reveals two things. First is that declining trust is a factor in reducing happiness. On average, people who say they can trust people are about 0.1 “happiness points” higher than those who don’t (out of a maximum of 3). So, the declining share of those who say yes to that question leads to declining happiness in the population.
Party Affiliation
However, including the trust variable in the statistical analysis still does not “explain away” the negative happiness trend. Given the political polarization, I included people’s political party identification, which ranges from strong Democrat to independent (which includes people in neither party or who do not respond) to strong Republican.
One finding that pops out is that independents are less happy than their Democratic or Republican counterparts. I must caution, however, about the direction of causality. Are party members happier because they joined the party and feel a sense of belonging in the organization, or does dissatisfaction with the party system and modern government make people become independents? We can’t answer that here. Nonetheless, the data show that party support on both sides of the political spectrum has been declining, which is associated with lower national happiness.

News Media Consumption
Still, even including the party affiliation variable does not make the negative trend disappear. The next variable I included was the responses to the question, “How often do you read the newspaper?” While the question does not seem to explicitly state a physical paper version, it certainly suggests that. Starting in 2005, the number of people responding “never” shot up. Before then, the average was about 5%; by 2018, it was nearly one-third.
And just as importantly, those who responded that they rarely or never read a newspaper report lower happiness levels. Again, the direction of causality is unclear, but it suggests that due to the internet, media outlets have become more fragmented. We have fewer, if any, news sources that can act as national uniters, and little sense that reporting is done for the national good. Rather each highly specialized (and opinionated) outlet caters to its own tribe, which implicitly helps to separate us and engender distrust. Reading the news, it seems, gives us greater civic purpose.
In fact, when I include these three variables in the analysis: the trust measure, the party affiliation indicator, and the frequency of newspaper reading, the yearly downward trend flattens out. In other words, these three indicators seem to account for much the drop in American happiness in the 21st century.
A Broader View: What We Haven’t Solved
What happened to the dream of peace and property? While I will have more to say in the next post on this topic, I will offer a few thoughts here. If we take a long-run view of humanity since 1870, we can see that while we have come a long way, there’s still much to be done.
Constant Wants
To the extent that economic growth generates the impulse for more consumption, we are constantly replacing our old goods with new ones. There is never a sense that we “have enough.”
Technological Insecurity
Related to our constant wants is the evolution of technology. As the current debate about artificial intelligence demonstrates, we find ourselves uncertain if new technologies will bring happiness or obsolescence and addiction (enslavement?). There’s every reason to believe that the “internet-ization” of society has increased our anxiety and reduced our self-esteem.[2]
Economic Uncertainty
The Global Financial Crisis of 2007-8 and its aftermath have demonstrated that we have not eliminated the business cycle or financial crises, and the severe dislocations that they create.
Income and Wealth Inequality
Economic inequality is getting worse in the 21st century. Inequality engenders unhappiness when we compare our incomes to the increasing number of one-percenters and social media “influencers.” Additionally, extreme inequality is associated with a loss of opportunities, which can be immiserating.
War, Conflict, and Hate
As the experiences in Ukraine and Israel and Palestine keenly demonstrate, war and conflict remain an ever-present reality. The political divisions exacerbated by Donald Trump show that we are a house divided, while media hate entrepreneurs peddle hate and misinformation for their own profit, with little concern for how its damaging the commonweal.
Pandemics
Not much needs to be added here, but only to say that something we thought was a distant memory may now be part of our future.
Climate Change
Every year that we delay weaning ourselves off of fossil fuels means greater and greater damage, suffering, and uncertainty. The Climate Kraken has been released.
Looking Ahead
What happened along the way to end the dream of peace, prosperity, and happiness–the striving for utopia? This will be the subject of my next post. Stay tuned.
—
[1] Note for simplicity, I take the average national happiness. To get the average individual happiness would require weighting the national averages by their respective populations.
[2] It seems anyone with a Twitter account is instantly an expert on everything, and they are all too quick to tell you that you are wrong and they are right, which is not good for our perceptions of self-worth.
Leave a Reply