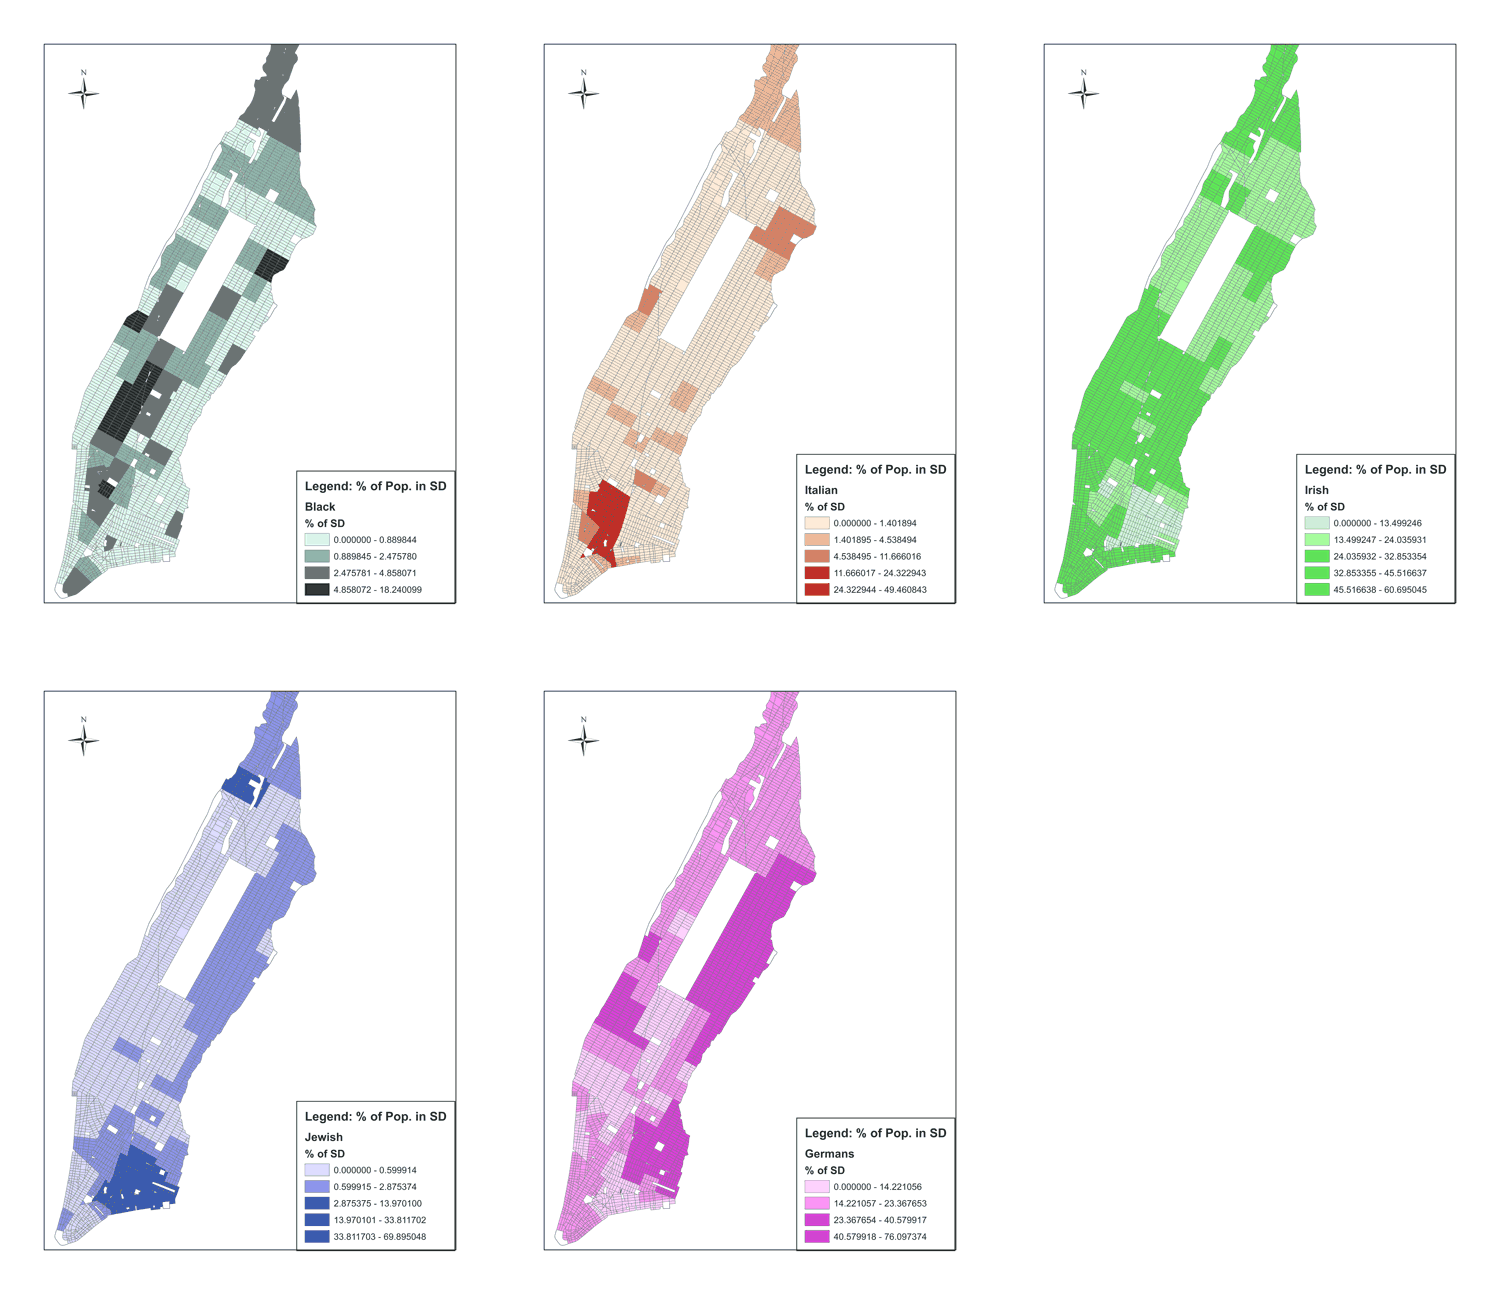
Figure: Population Density by Race and Ethnicity in 1890.
These maps show the relative concentration of different racial and ethnic groups in each of Manhattan’s Sanitation Districts, which were the size of large neighborhoods. An 1894 report by the Census Bureau tracked the health status and mortality rates of residents by Sanitation District from data collected in the 1890 Census.
Leave a Reply