Jason M. Barr January 31, 2022
[Note this post is the fourth installment in on-going series on the history of the floor area ratio (FAR) and modern zoning. The rest of the series can be found here.]
Housing affordability is a major concern for New Yorkers. Gotham’s renaissance in the 21st century has drawn in more residents, workers, and tourists, paying top dollar for scarce housing. On the supply side, there is a suite of “frictions” that slow down the creation of new housing to match this demand. These include the high cost of land and construction, the difficulty in acquiring sites and tearing down old structures, and the rise of “NIMBYism” (“not in my backyard”), where residents engage in lawsuits or have their Community Boards lobby to stop more housing. The city’s zoning codes likely also play a role.
YIMBY Versus NIMBY
To most people, zoning—the rules that dictate what landowners can (or cannot) do with their properties—is an arcane subject. Yet, for a small group of initiates, it is a subject of great passion. The battles between the YIMBYists (“Yes, in my backyard”) and NIMBYists are fundamentally about whether these regulations should become more permissive, such as allowing high-rise towers on low-rise blocks or permitting single-family homeowners to subdivide their dwellings.[i]
YIMBYists see loosening the zoning rules as the “low hanging fruit” for affordable housing. While NIMBYists see restrictive zoning as protection against what they perceive as a range of evils that would otherwise be inflicted upon them, including gentrification, the loss of historical landmarks, and more traffic congestion.
Though some of these fears are valid, one fact is clear: a city can’t dig its way out of a housing affordability problem. The more restrictions imposed and the more it says “no!” the deeper the hole gets. Residents might say, “Construction is fine as long as it’s not in my neighborhood.” But when every community says that we have a problem. No one wants to be left holding the “hot potato.” And the debate about where more housing should go rages on.
However, reforming the zoning rules has traditionally been the third rail of housing politics (though there has been some recent talk about pro-housing policies from Governor Hochul and Congressperson Alexandria Ocasio-Cortez). No mayor since 1960 has been able to effect wholescale zoning reform. This begs the question: How have the zoning rules changed over the decades, and is zoning really to blame for the city’s affordability problems?
Crunching the Numbers
To this end, I crunched the numbers. I will detail my findings below but suffice it to say, the role of zoning on New York’s housing market shows some surprising and seemingly contradictory facts. On the one hand, the theoretical maximum population that the city could hold—in terms of housing units—has increased from about 11.9 million in 1961 to 16.6 million today—an increase of 1.4 billion square feet (130 km2) of residential space.[ii] From this perspective, one could say that changes in the zoning codes have allowed the city—in theory—to nearly double its current population of 8.8 million.
On the other hand, only a handful of areas have seen a practical loosening of the rules, primarily in the old manufacturing and commercial centers. The rest has remained relatively static. In fact, only seven out of 59 Community Districts are responsible for 55% of the total net increase in allowable residential floor area. And 25% comes just from Lower Manhattan and Midtown.
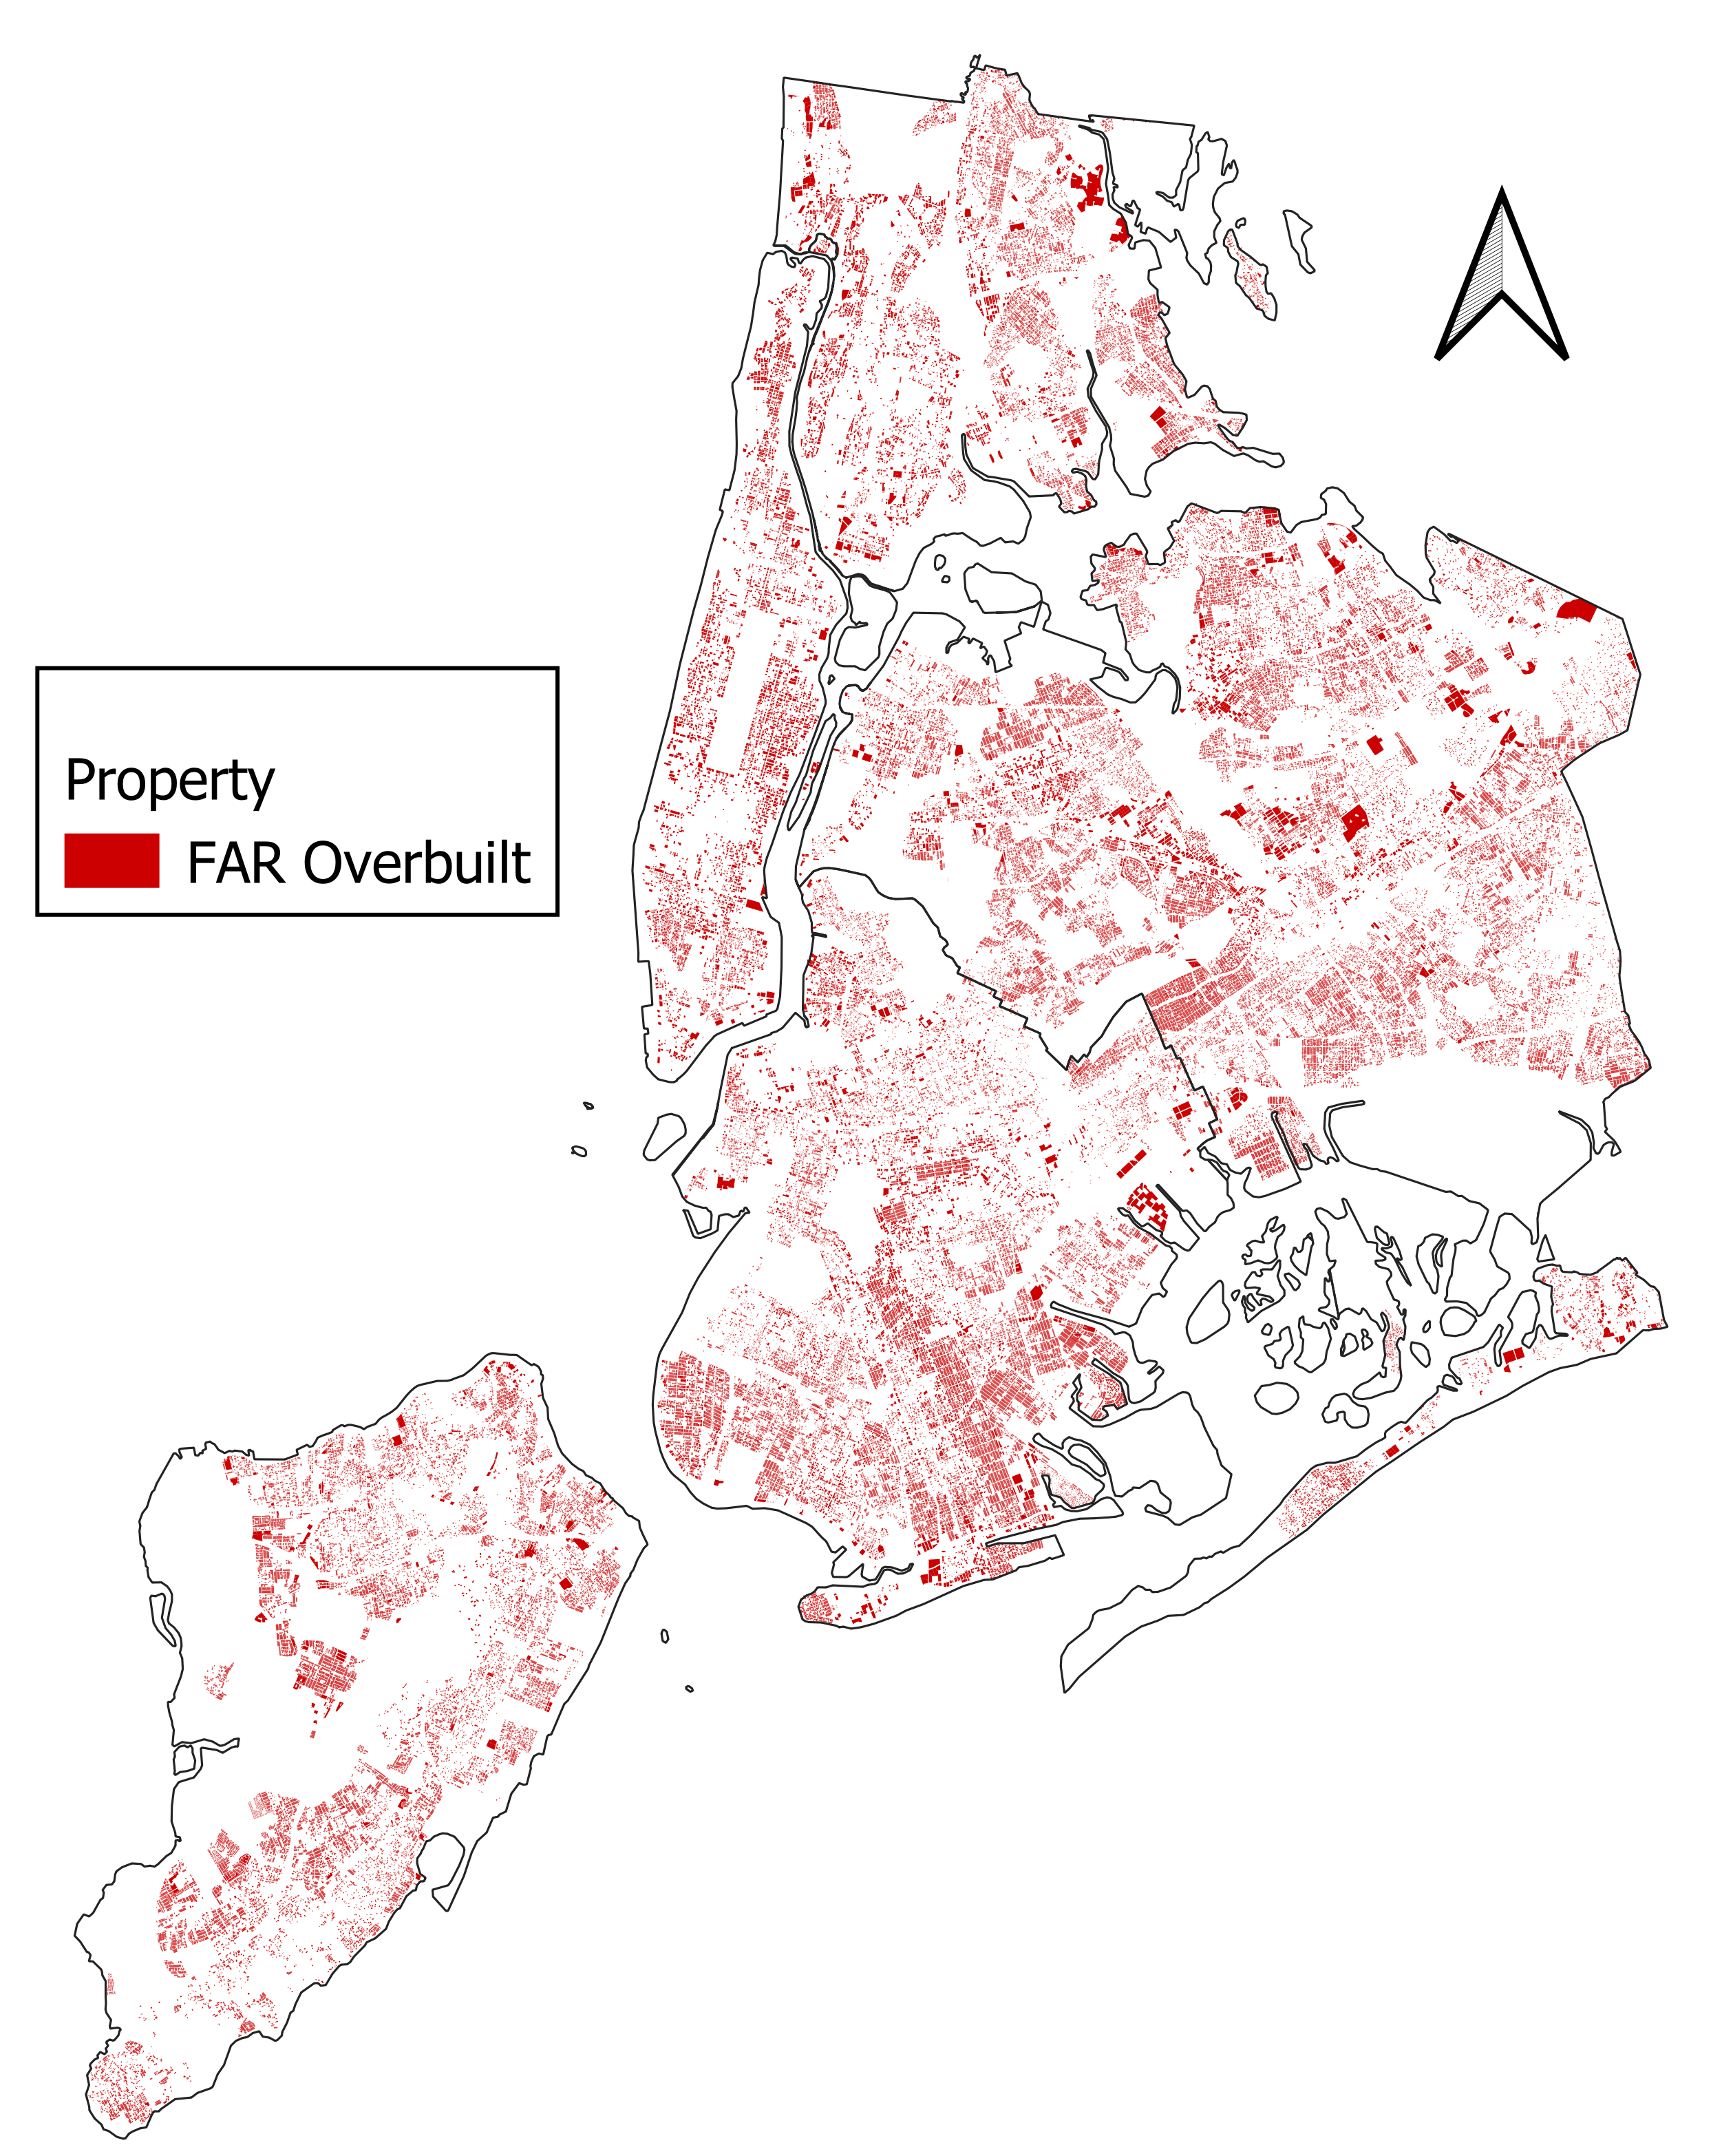
For that matter, much of New York is already built out past the current maximum allowable floor area. 39% of residential properties now are at or exceed the current permissible floor area because they were grandfathered under older regulations.
Before we turn to the specific findings, let’s first review the rules and their history.
Zoning in the 21st Century
Today, there are two key components to zoning (though hundreds of specific rules and regulations). The first dictates each property’s use: residential, commercial, or manufacturing. Some properties in commercial districts allow for mixed uses, such as ground-floor retail in an apartment building. And in other cases, property owners can choose their uses. But the vast majority of properties require only one use, especially in residential neighborhoods.
The idea is that by separating structure types, residents are protected against harm that businesses or industries might impose, be it traffic congestion, noise, or air pollution (i.e., negative externalities.)
The FAR Dome
The second method by which zoning regulates buildings in New York is limiting the so-called Floor Area Ratio (FAR). The FAR is given as a multiple which indicates the amount of floor area relative to the size of the lot and thus dictates the total amount of building space that can be provided.
This limit essentially places New York under a hypothetical dome that caps the total amount of building space when added up for each property. As we shall see below, this dome was created by design–by planners during the Great Depression who intended to keep New York from becoming ever denser.
The Empire State Building
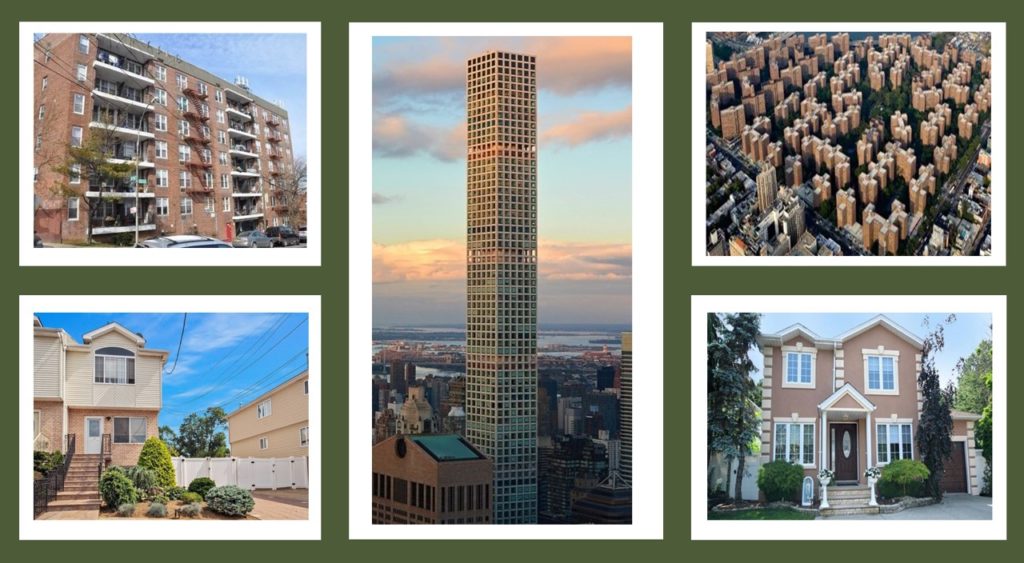
To give some examples of the FAR, let’s take the case of the Empire State Building. It has 102 floors with 2.8 million square feet of space (260,129 m2). The lot is 91,351 square feet (8,487 m2), giving it an actual built FAR of 31 (2.8 million/91,351). However, if the building owner decided to tear it down and create a new office skyscraper, the “base” allowable FAR is only 15. The developer can get another 3 by providing a plaza and perhaps buying some air rights that might get it back to 31. But suffice it say, under current zoning rules, a rebuilding of the Empire State Building would have to overcome many zoning hurdles and would likely not be possible “as of right.”
Douglaston, Queens
If we travel to the city’s suburban areas, we can look at the FARs there. For example, let’s take the super-leafy neighborhood of Douglaston, Queens. A randomly chosen house built in 1925 has an actual FAR of 0.3 (2,427 ft2 on an 8,000 ft2 property), while the law allows a maximum of 0.5. In theory, the owner of this house could tear down the property and build a 4,000 square foot (372 m2) “McMansion.” The fact that this current home is “underzoned” suggests that zoning, in and of itself, may not be the sole friction to neighborhood densification.
A Brief History of New York City Zoning
But how did the city get to the FAR as its primary way to limit density? The short answer is that it was a decades-long process to limit city growth.
1916: Envelopes and Wedding Cakes
Starting in 1913, New York began to consider the idea of zoning, which did not exist at the time. As discussed in more detail in another post, reformers were horrified by what they thought of as a suite of urban ills tied to the free market in real estate: “slums”—created by greedy landlords—were overcrowded vectors of disease, vice, and poverty; skyscraper districts were over-congested canyons, where ego-building was destroying the property values of innocent landlords next door. Apartment buildings were being constructed out in the suburbs, where free-standing, single-family housing ought to be.
The result was the 1916 Zoning Resolution which created three sets of maps. The first established the so-called setback rules. As a building went taller, the upper floors had to be set back from the street based on a formula. In Downtown and Midtown, the rules incentivized the so-called Wedding Cake style of building. The second set of maps dictated commercial, residential, or unrestricted use. The last set dictated allowable lot coverage, ensuring open space around each building.
The Disappointments of the Roaring Twenties
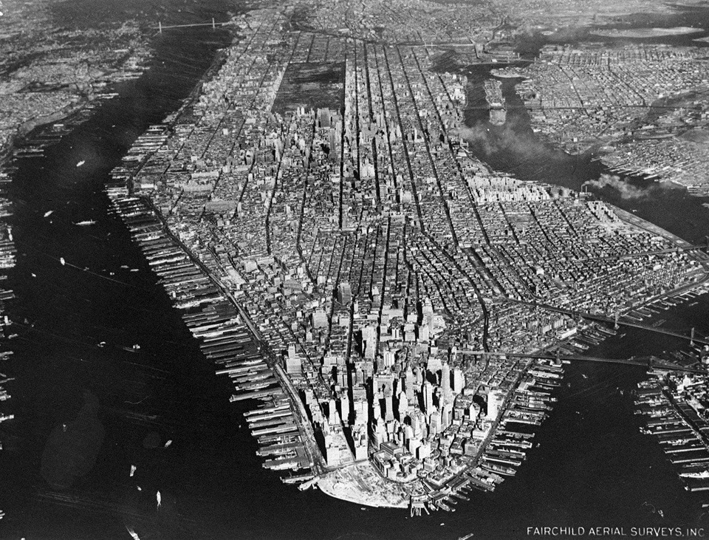
To planners, however, the real estate boom of the Roaring Twenties was a disaster. Midtown and Downton saw the rise of the new crop of record-breakers. The Bronx and Brooklyn saw neighborhood after neighborhood give way to apartment buildings. And inner-city slums remained. The problems of density seemed just as bad after zoning as before.
In 1934, a report published by the New York City housing authority estimated that if fully built out, New York could hold 77 million residents and 343 million workers. These figures were then used as propaganda to change the rules.
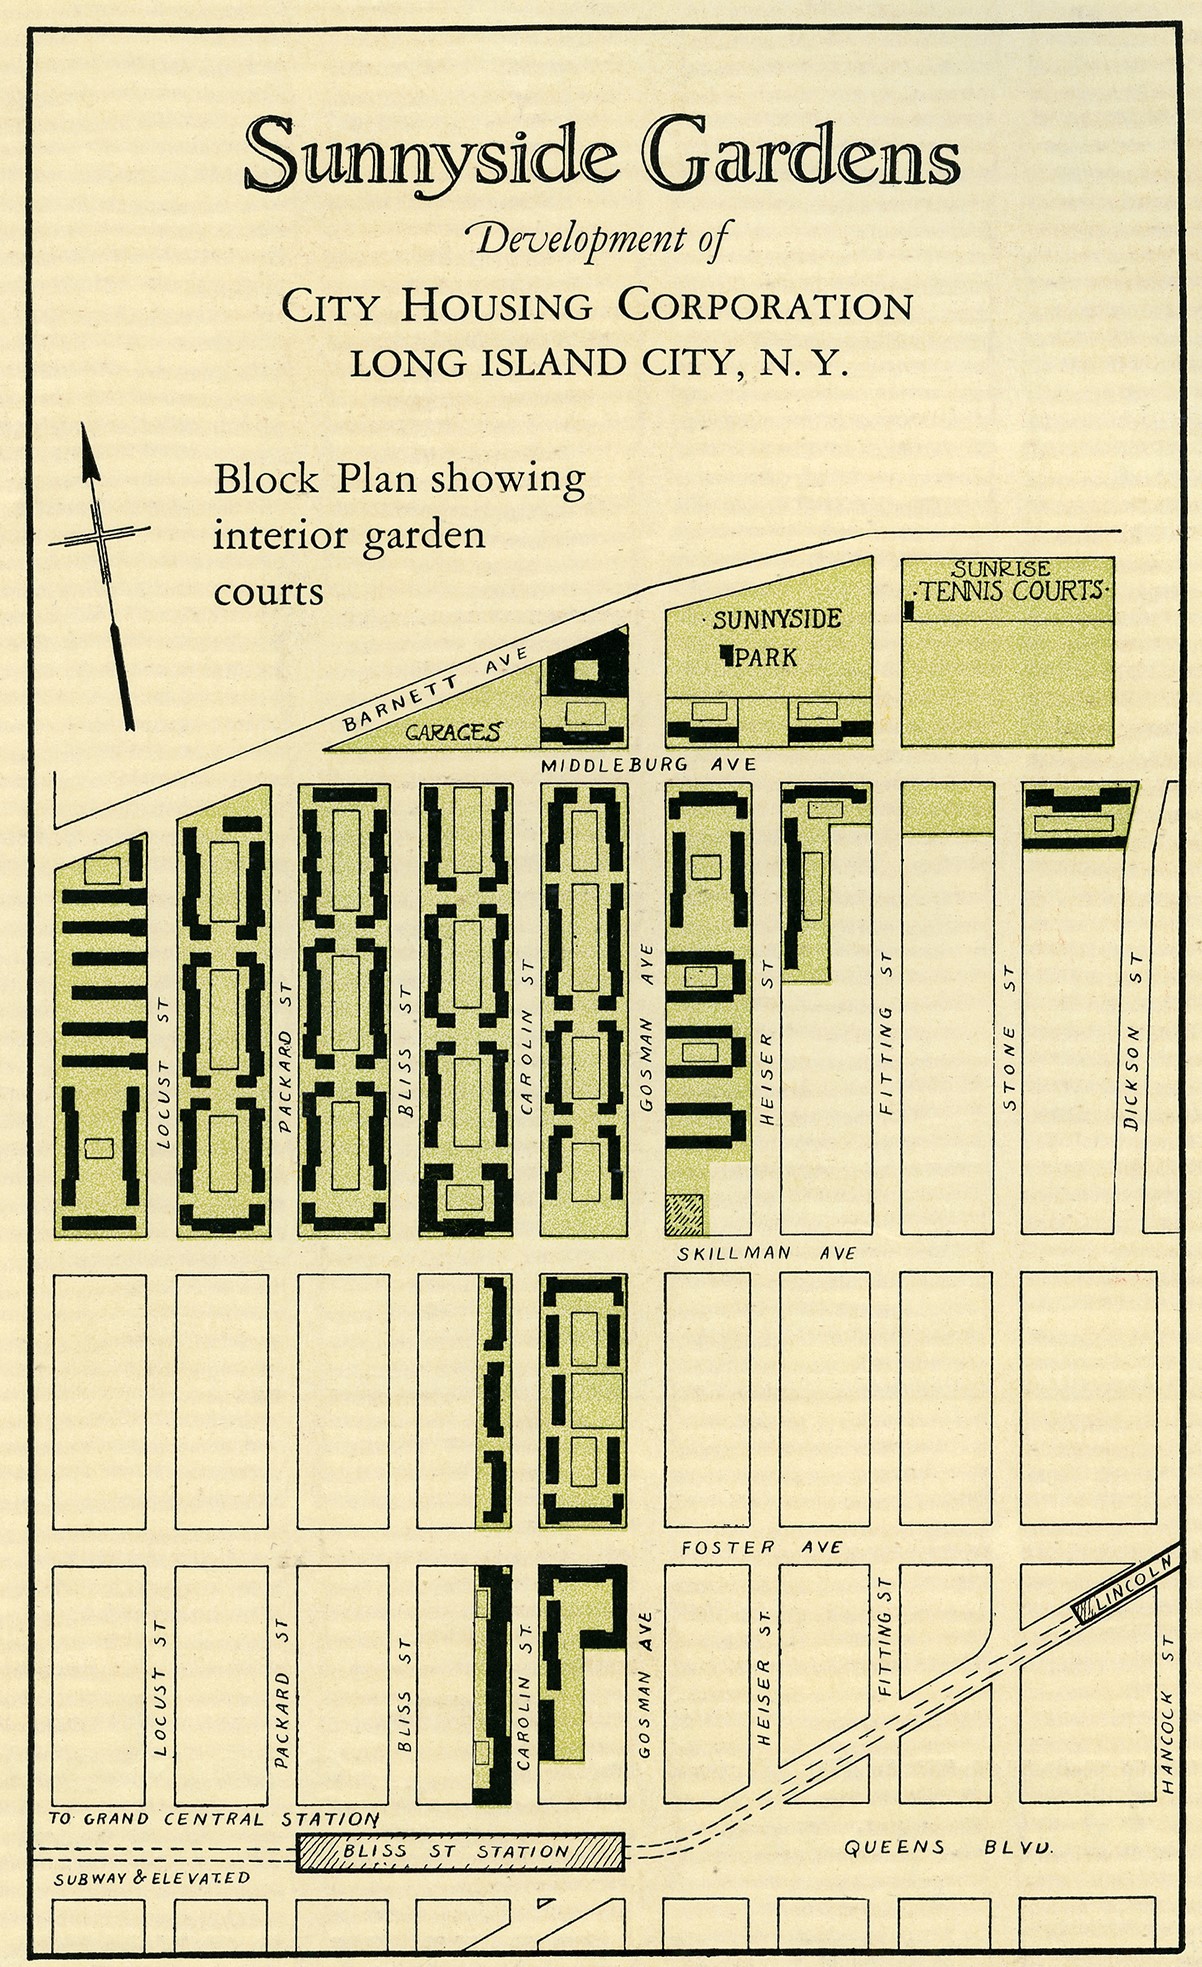
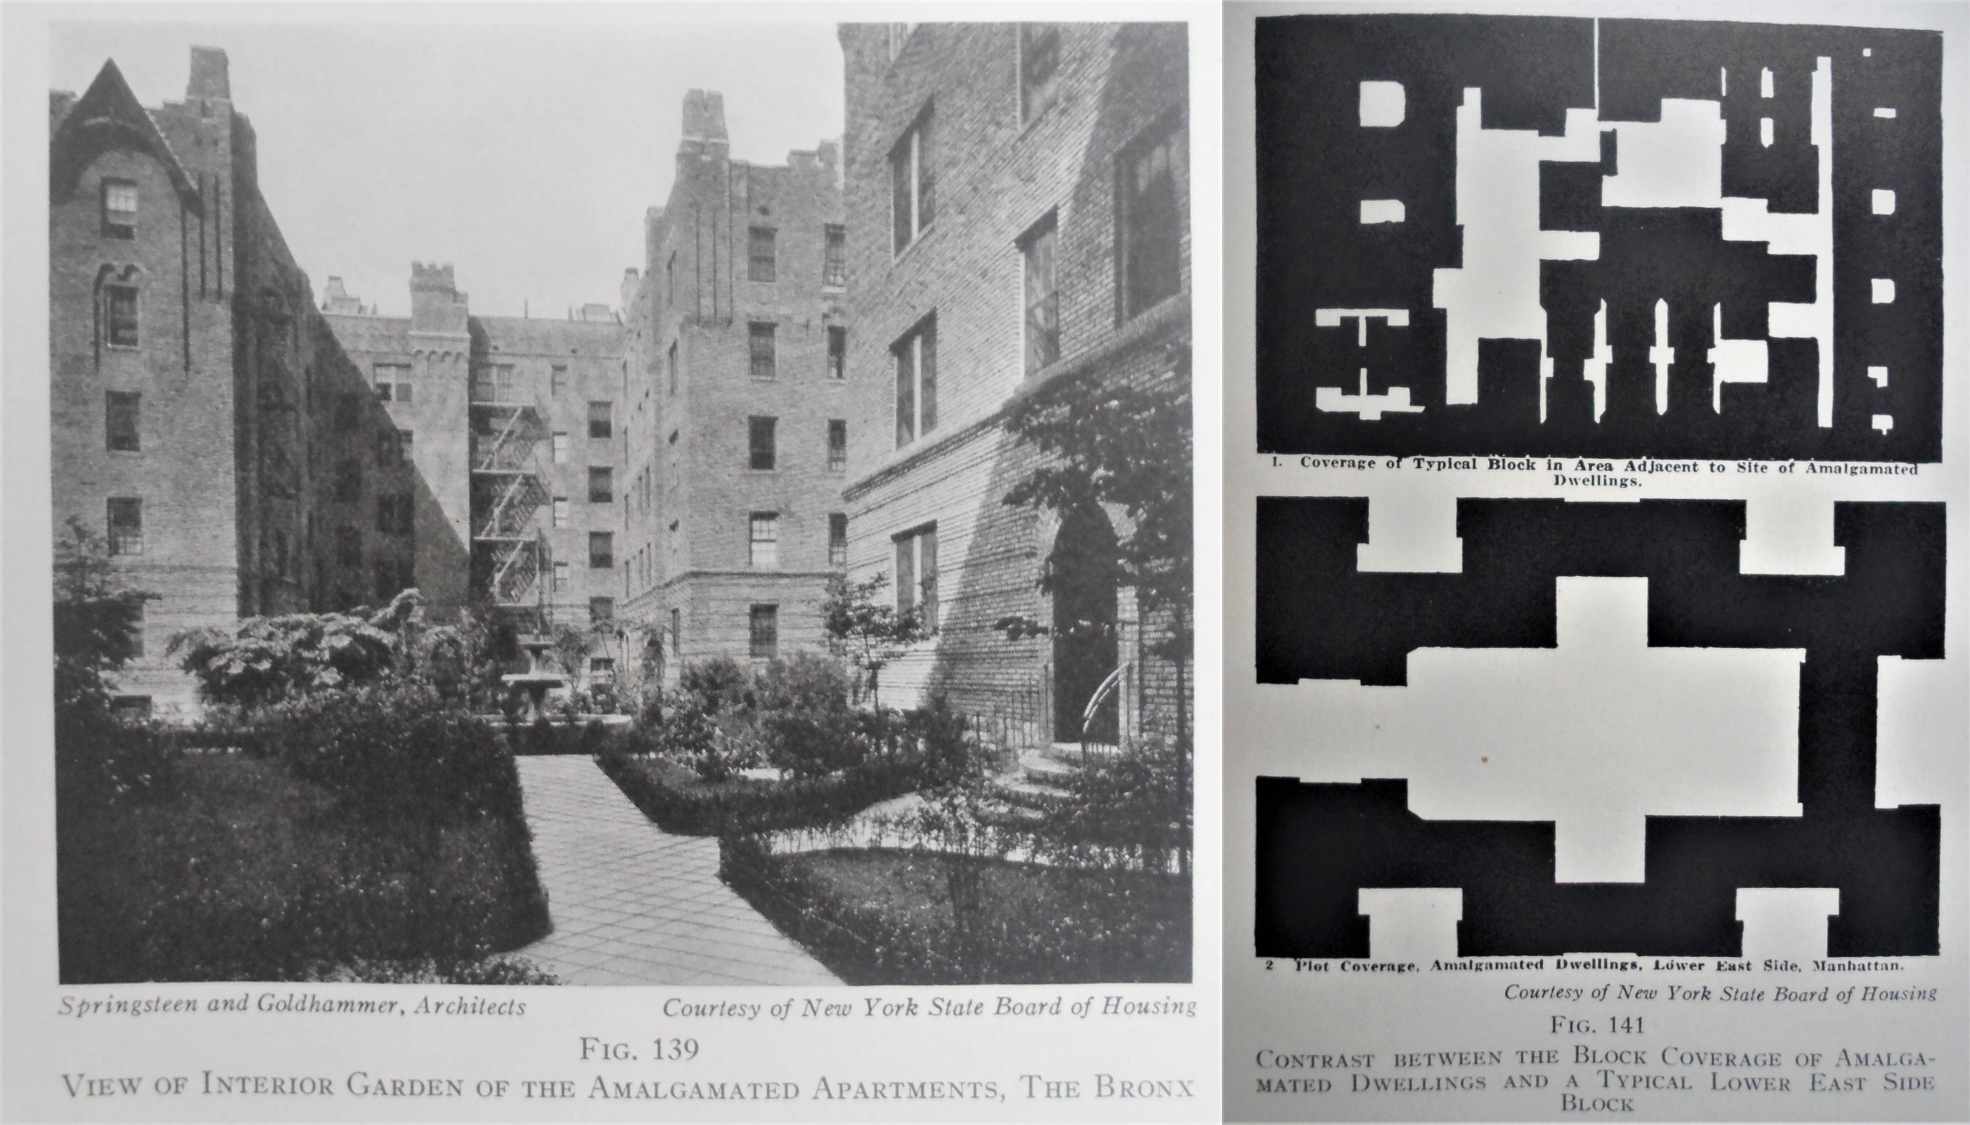
The Great Depression gave voice to a new generation of reformers. World War I had demonstrated to many the power of government planning and, along with the Garden City movement, allowed planners to work toward downzoning the city in the name of “Better Living through Planning.” Out of this zeitgeist emerged the current regulations.
1935: The Birth of the Floor Area Ratio
In the public consciousness, 1961 saw the birth of the FAR when New York adopted it citywide. But this is not true. While I have detailed the story elsewhere, let me summarize. In 1935, Robert D. Kohn, architect and planner, with help from the architect and technocrat Frederick Ackerman, wrote a report for the City Club of New York, urging the floor area ratio to limit building bulk.
Kohn’s document was studied by Mayor Fiorello La Guardia’s administration (with funding support from the Works Progress Administration), which created its own report, “Zoning for the City of New York,” written by Theodore T. McCrosky in 1938.
This report set the blueprint for modern zoning. Instead of three sets of maps—one for use, height setbacks, and lot coverage—McCrosky proposed one set of maps, with use districts and FAR limits combined. From there, the idea of the floor area ratio spread throughout the United States and beyond in the 1940s and 1950s. Finally, a quarter-century after it was introduced, it returned to Gotham and went into effect in December 1961.
Post 1961
The original zoning maps issued back then have continued to evolve. The rules are not wholly static, and adaptations reflect changing realities. Here, I itemize a few of the most important alterations.
Air Rights
One of the earliest discoveries about floor area ratio limits was that it made “air” a valuable commodity. While the city created a FAR dome, the “shape” of the dome could depend to some degree on the private market. Let’s say you have an old office building with a FAR of 5, but you are allowed to have a taller building with a FAR of 10.
If you so desire, you can sell the unused airspace to your neighbor for a negotiated price. The neighbor gets to build taller, and you are compensated to keep your building at the lower density. The total FAR of the block does not change. Planning officials recognized the right to sell unused development rights in the 1970s, and this market has been an important part of zoning ever since. I will have more to say about “air rights” in a future post.
Mixed-Use Zones
In 1991, the city classified some neighborhoods as mixed-used, particularly in districts that formerly had significant office or loft space that could be readily converted to housing. The lot owner has the right to choose between the older zoning designation (say manufacturing) or residential. Today about 3,900 properties (0.5%) are zoned for mixed-use. This has been particularly important in Lower Manhattan, where aging skyscrapers have been converted to apartments.
Landmarked Neighborhoods
The demolition of the old Penn Station in 1963 gave rise to the preservation movement in New York and the creation of the Landmarks Preservation Commission. Individual buildings can be declared landmarks, and their facades cannot be altered. Whole neighborhoods have also been designated historic districts. Within them, owners cannot tear down these structures even if their current FARs are less than the allowable maximum. Today, 3.6% of properties are in a historic district throughout the five boroughs. For Manhattan, that number is 27% (though only on 11% of its developable land).
Contextual Zoning
In 1987, the Quality Housing Program was established, which sought to promote architecture in line with the historic urban fabric by including street wall provisions and maximum building heights. The goal was to have new buildings mirror the older ones. The use of the FAR (particularly with FAR bonuses for plazas) promoted tower-in-the-park development. By the 1980s, many felt it was bad urbanism.
Today, 39% of properties have some contextual zoning regulations. The contextual rules, however, often make achieving the maximum allowable FAR difficult, if not impossible, since they might require height limits or other architectural features that would limit the possible building space. It’s likely another source of “frictions” for providing new housing, and it’s a topic I hope to return to in the future. In my analysis below, I do not consider the impact of contextual zoning on the maximum allowable FAR, and thus my values for 2021 might overstate the theoretical maximum.[iii]
Rezonings
As New York’s economy and neighborhoods continue to evolve, some old zoning designations are no longer relevant or helpful. For this reason, large parcels or neighborhoods can undergo large-scale rezonings.
This can take place in one of two ways. The first is on the initiative of the property owner. In 1975, the city created the Uniform Land Use Review Procedure (ULURP), allowing private developers to petition to change a property to a use that the developer prefers. The ULURP process is often drawn out since many players are involved. Whether it’s good or bad for the housing market is left for another discussion. But suffice to say, it’s been used to convert old industrial sites to residential and commercial land.
Second, rezonings can be initiated by the city government, which works toward changing the maps in particular communities. Most recently, this has taken place around the Gowanus Canal in Brooklyn and in the SoHo and NoHo neighborhoods in Manhattan. In 2010, NYU’s Furman Center looked at the city’s neighborhoods rezonings under Mayor Bloomberg and found that the number of upzonings more or less matched the number of downzonings, so the net increase in allowable floor area was slight.
Sixty Years of the Floor Area Ratio: What Has Changed?
Economists debate to what degree zoning creates frictions in the housing market. To provide evidence, I have performed an analysis that compares the 1961 zoning maps to those of today. Here, I investigate the following questions: How have residential floor area ratios changed over the years, and what do these changes say about the city’s ability to grow its housing stock? More details on data sources, preparation, and analysis can be found here.
Maximum Capacity
For 1961, I estimate that if the city had been fully built out, it could have had 7.6 billion square feet (710 km2) of total building space, with a maximum of 4.8 billion square feet (442 km2), or 62%, for residential.
Assuming a citywide average of 400 square feet (37 m2) per person, the residential population was capped at a theoretical maximum of 11.9 million.[iv] In 1960, the city’s population was only 7.8 million. The 1961 rules, however, represented a sizeable downzoning from the 1916 codes, which had a theoretical maximum population of 55 million around that time.
What has happened since 1961? Today, if built to maximum capacity, the city could hold up to 8.2 billion square feet (762 km2) with 6.5 billion square feet (604 km2), or 78%, for residential, which could contain a theoretical maximum population of 16.2 million people.
Uneven New York: A Tale of Two Cities
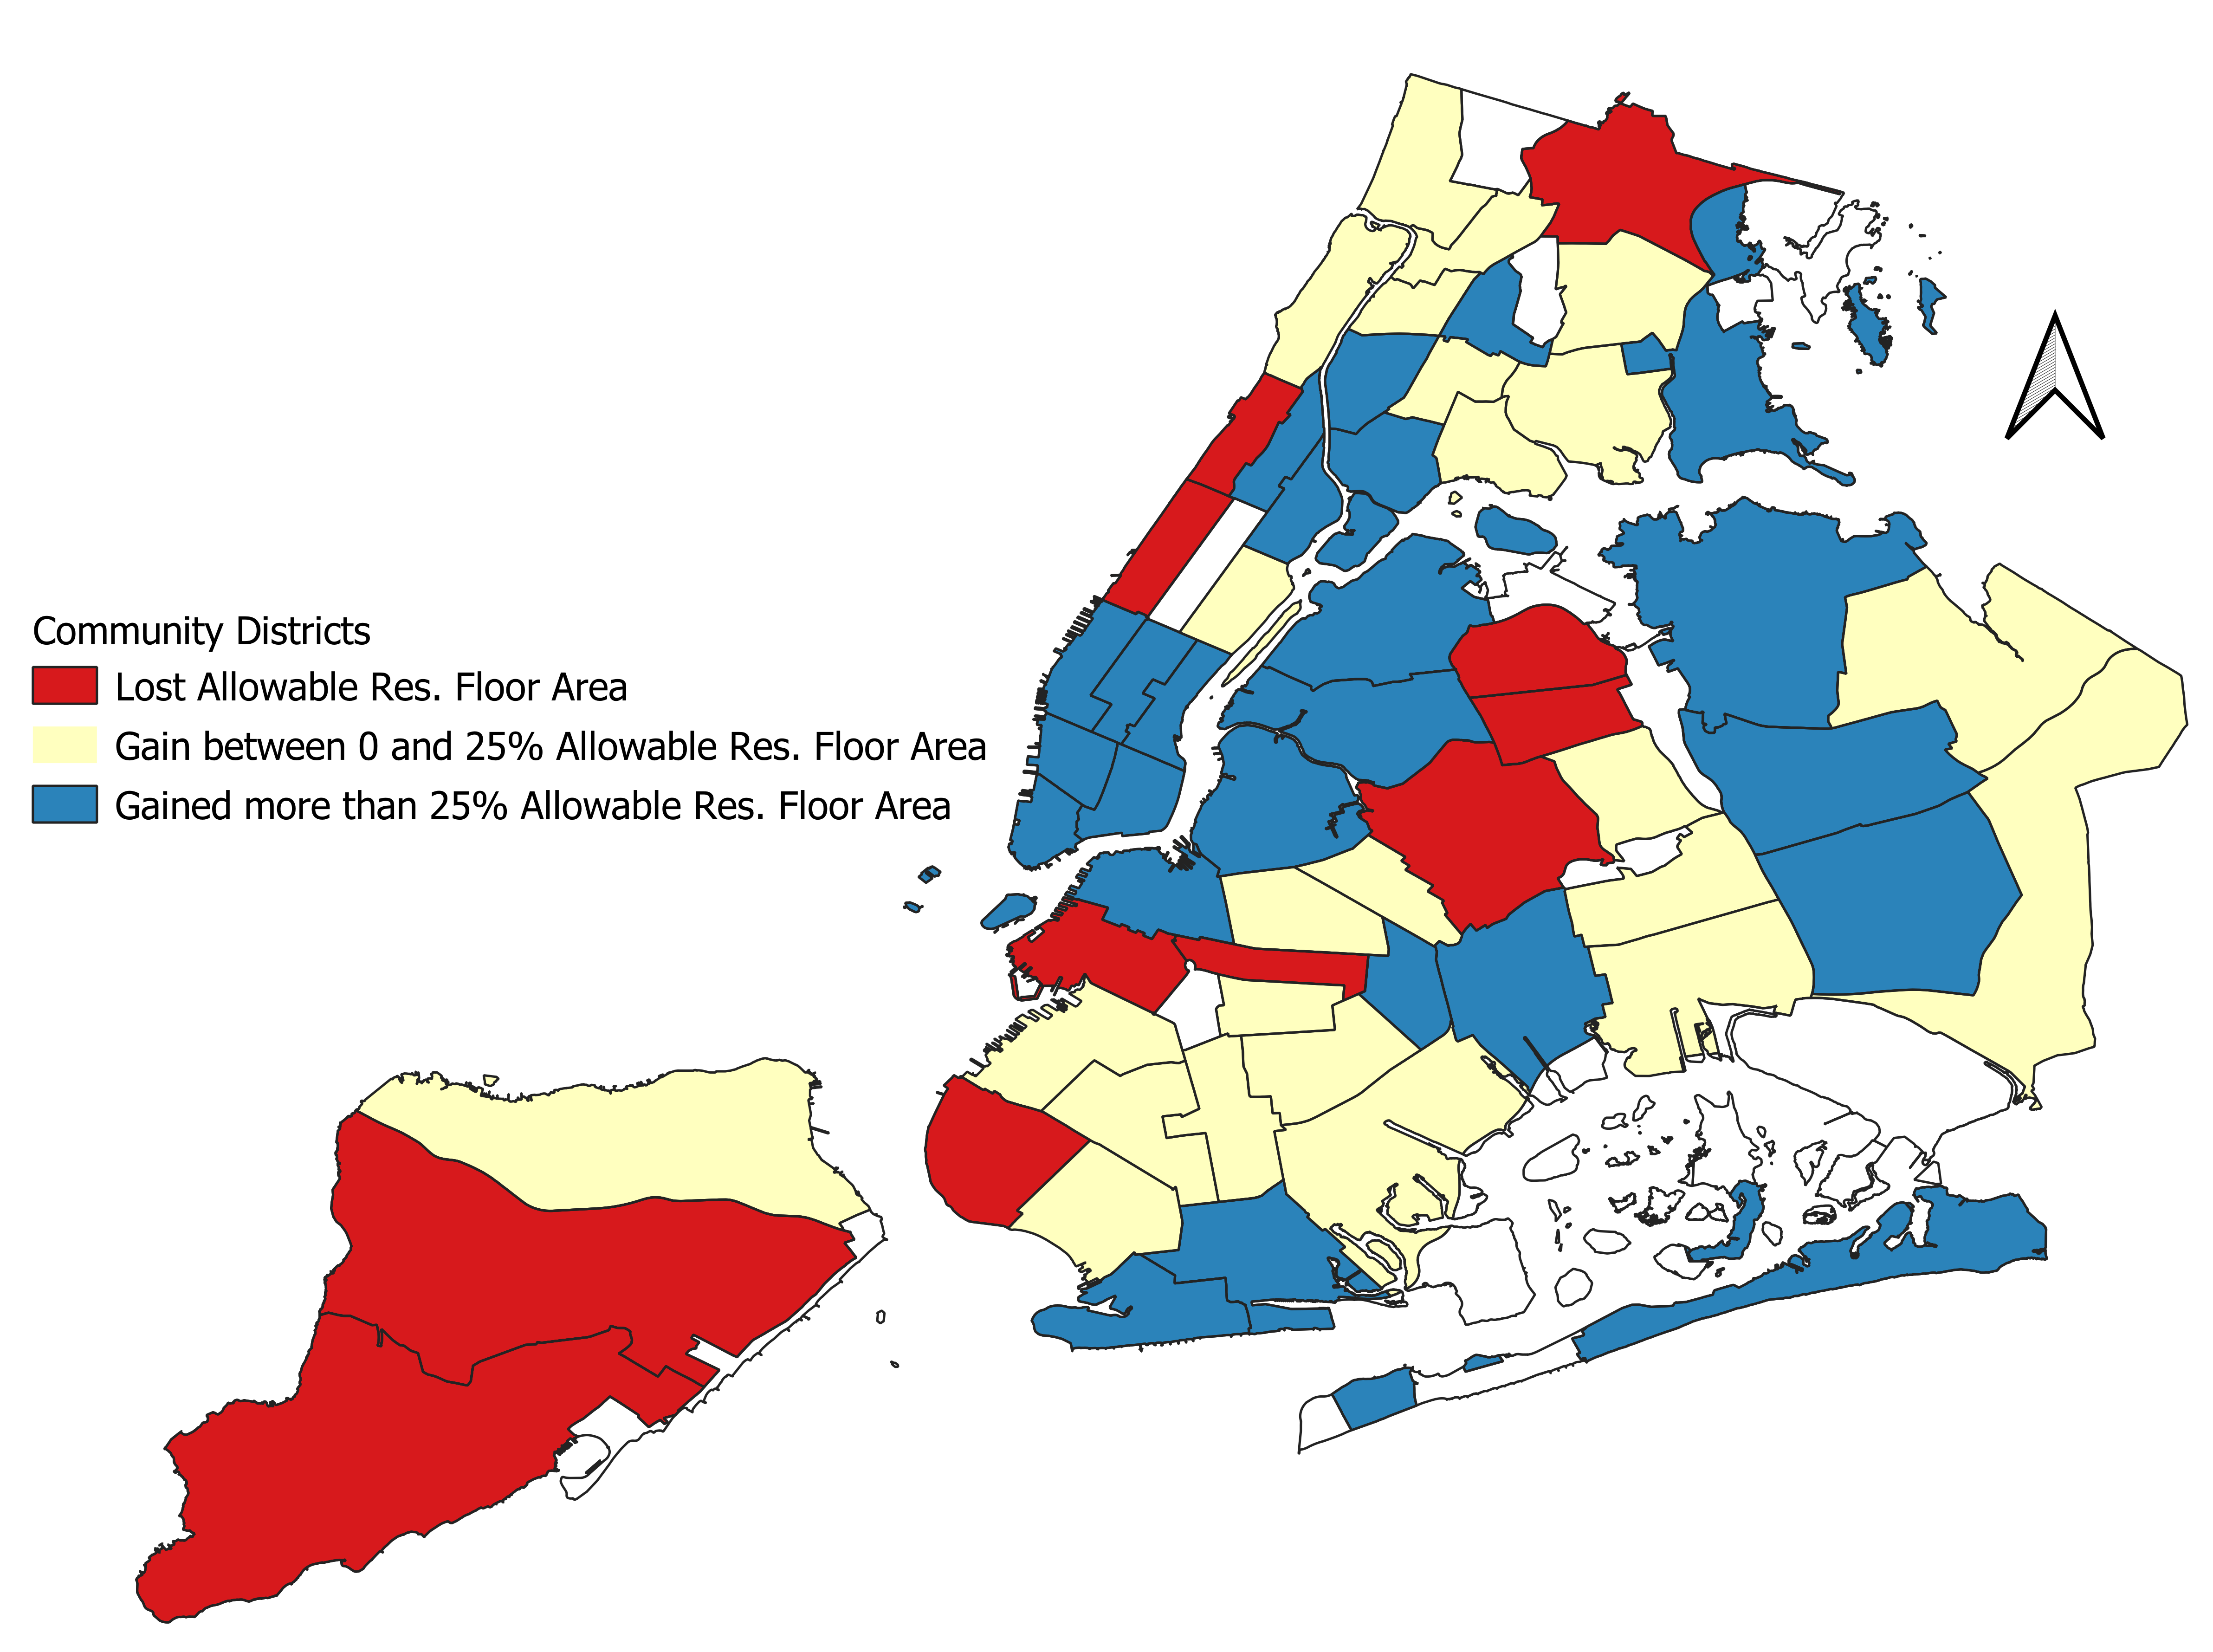
It would seem, on the surface, that the city’s zoning rules are not a direct barrier to building more housing. The total theoretical maximum permissible residential building space has grown by 36% over six decades. However, when one drills down a bit and looks across New York’s neighborhoods, one sees a tale of two cities.
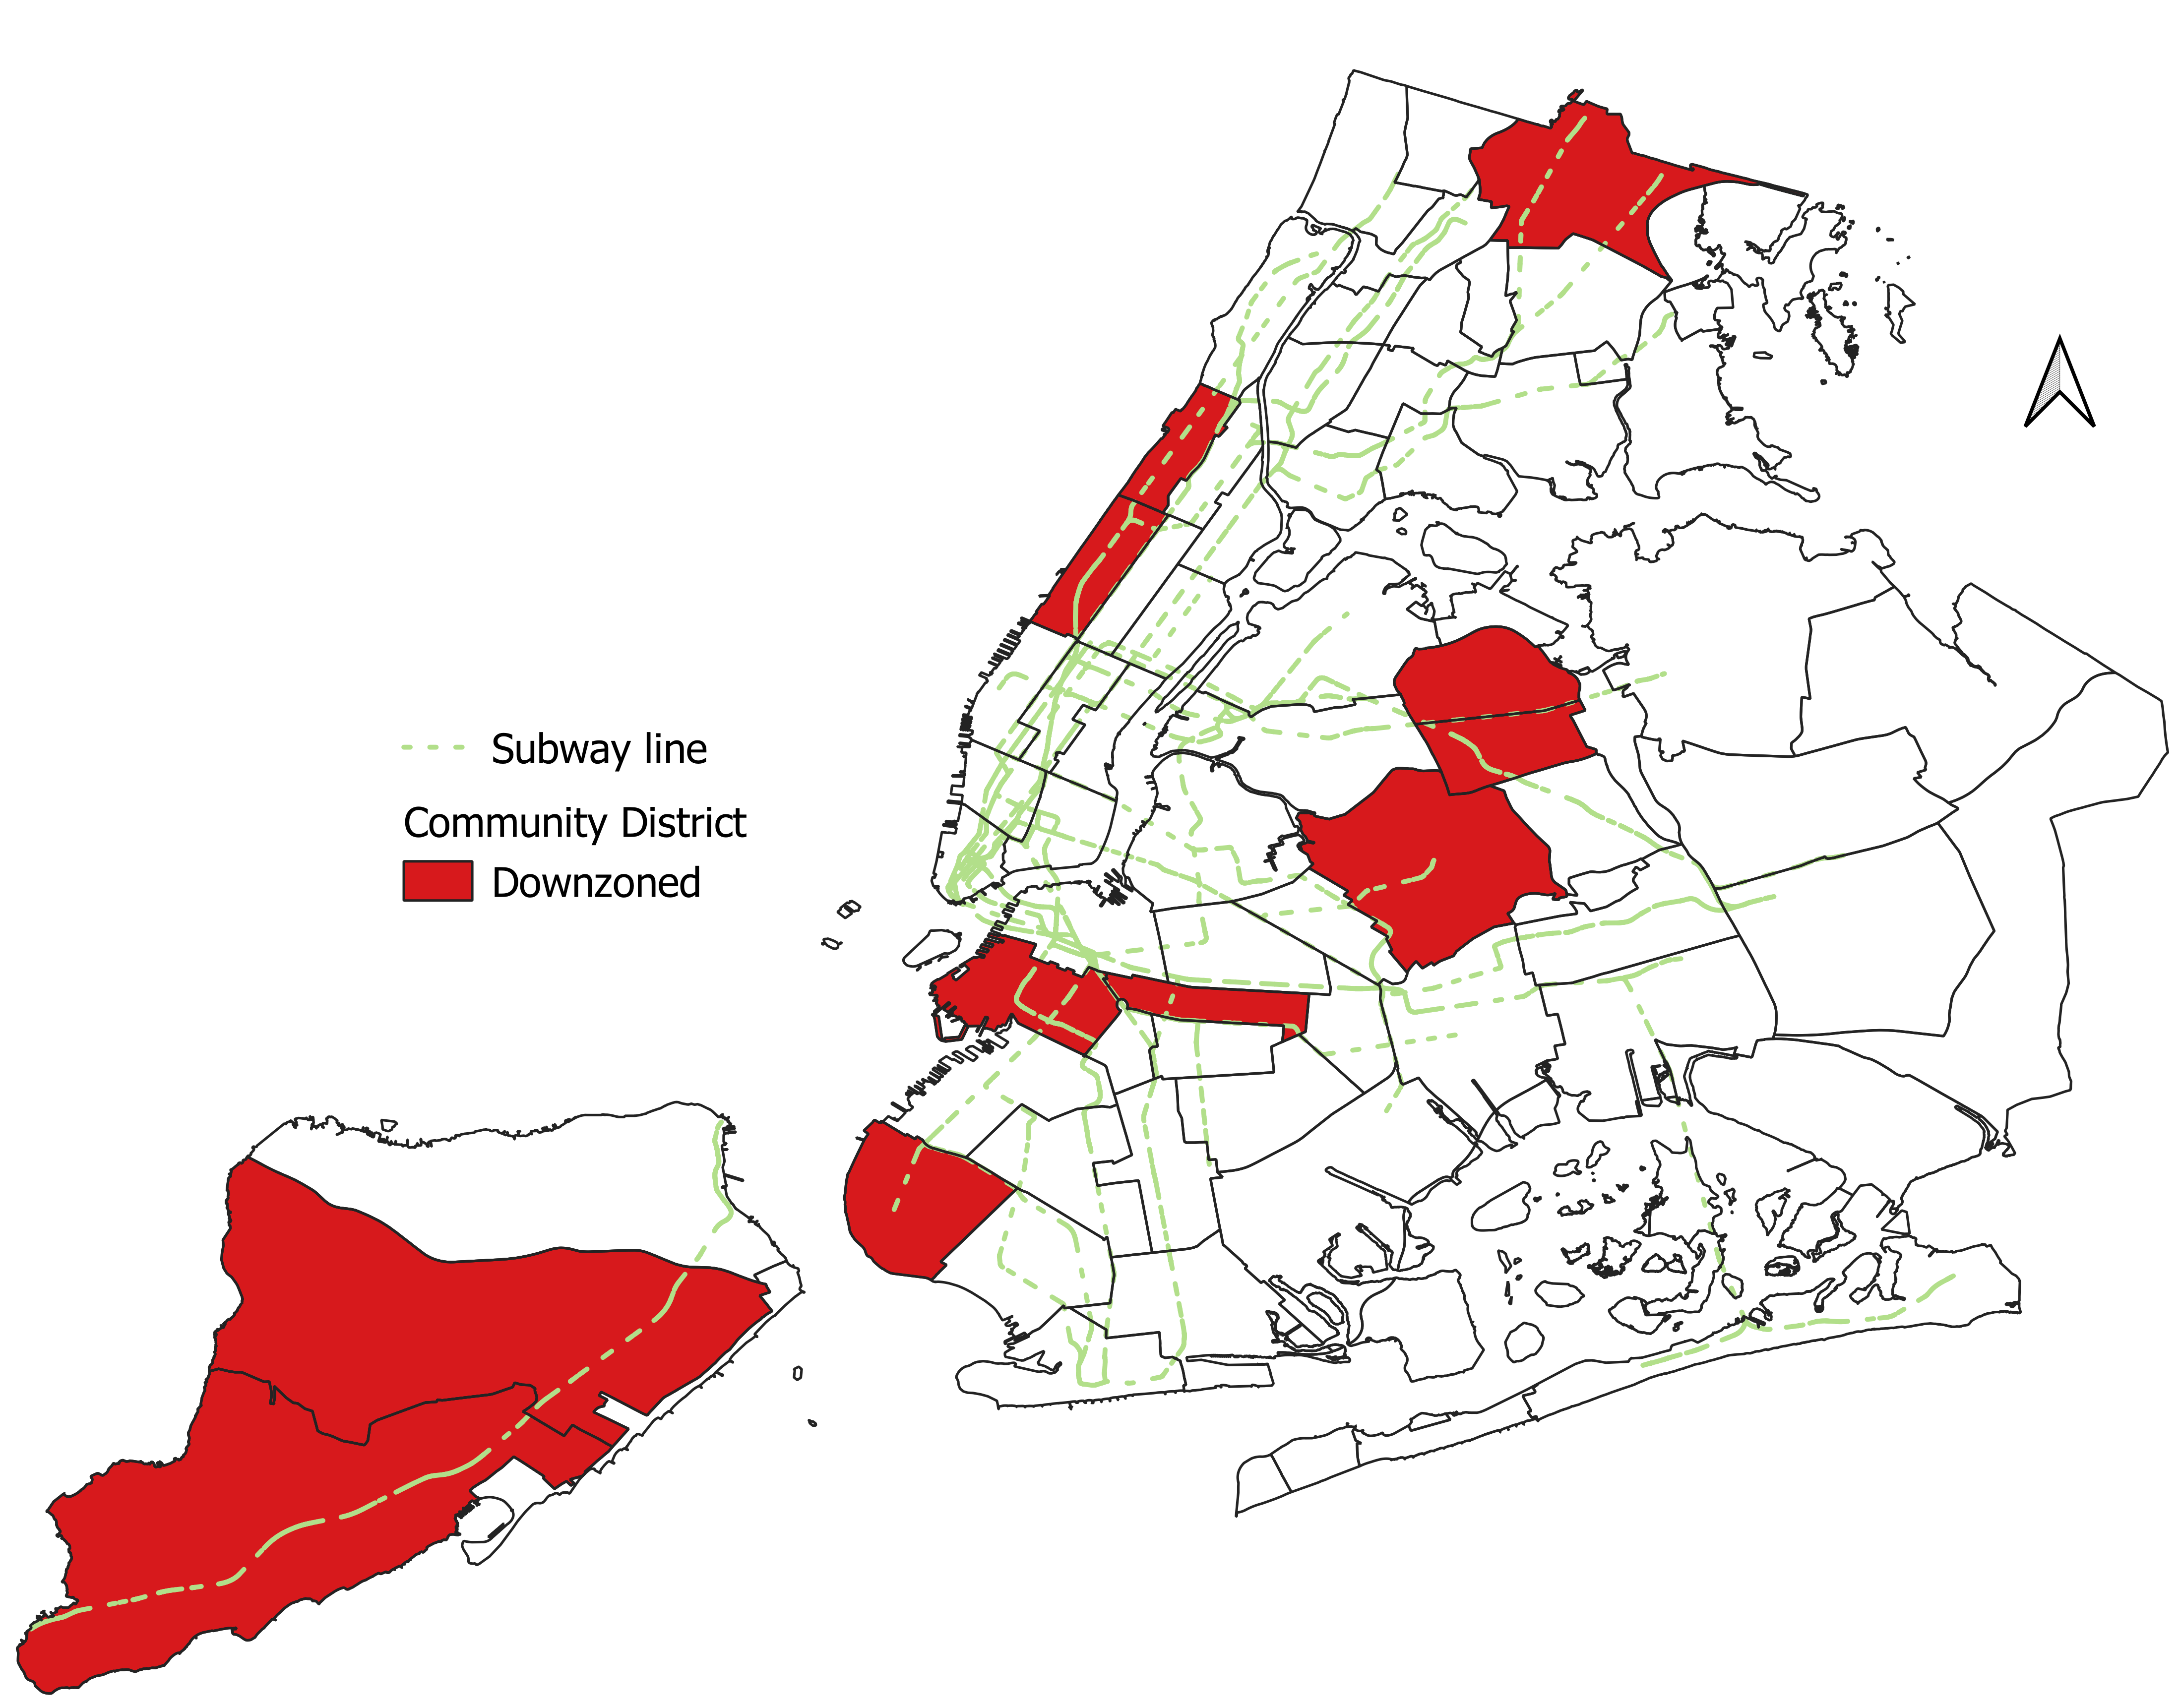
Across the 59 Community Districts (CDs), eleven (19%) lost allowable floor area either through downzoning or historic district creation. More striking is that all these Community Districts also have subway lines running through them. That means, by design or accident, New York has reduced the transit-oriented city.
Because of the difficulty in assembling lots, the costs of new construction, and the time it takes to shepherd the process to completion, one would surmise that the maximum allowable floor area should increase by a relatively generous amount to “compensate” the developers for the high costs of new construction.
Let’s use the admittingly arbitrary number of 25% for the assumed threshold for allowable floor area growth that would presumably incentivize more construction (the actual number is left for future research). The data reveal that nearly 60% of the CDs had allowable FAR growth (or decline) of less than 25%. On the other hand, maximum allowable floor area growth of greater than 50% has occurred in only 20% of the Community Districts.
In summary, an analysis of upzonings and downzonings shows that 11% of Community Districts have reduced the total amount of allowable residential space—i.e., they have been downzoned and cannot densify. 60% of CDs have either been downzoned or have seen limited growth in allowable residential building space. Only 20% of neighborhoods have seen significant jumps in allowable housing, mostly in the central neighborhoods, like lower Manhattan and Downtown Brooklyn. In fact, five CDs are responsible for 50% of the total increase in the maximum allowable residential floor area.
Overbuilt Gotham
As discussed above, the zoning rules dictate the maximum allowable Floor Area Ratio (FAR). But ultimately, whether higher FARs incentivize more construction depends on the buildings that already exist. Many residential structures were completed before the 1961 codes, with 71% of the city’s residential buildings built before 1951.
So, if a developer is going to tear down an older structure to build a denser one, the allowable FAR needs to be sufficiently higher than the current one. However, we see a hurdle to new construction once we compare today’s maximum allowable FARs to the actual built FARs.
Currently, 39% of the city’s residential buildings are above their respective allowable FARs, and 63% are above or within 25%. In other words, for nearly two out of every three residential buildings, it is either impossible or uneconomic to tear the building down to increase housing availability.
The distribution of the “extra FAR,” especially in the outer boroughs, is nearly random, making the problem worse. 50% of the city’s properties with extra FAR are on lots of 2,500 square feet (25’ x 100’, 232 m2) or less. To effectively use that extra FAR requires buying up neighboring properties to make the economics more favorable. In sum, only 54% of the city’s residential buildings have extra FAR, and at least half of those are on small lots.
Policies
The question of this post has been to what degree does zoning, especially limits on the floor area ratio, create barriers to new housing construction that could reduce the affordability crisis? The analysis shows that, while the theoretical maximum of allowable residential FAR has grown 36% in sixty years, many neighborhoods have either been downzoned or not seen meaningful gains that encourage construction. In fact, it appears to that increases in allowable FAR growth have occurred mostly in Lower Manhattan, Midtown, and gentrifying neighborhoods.
For that matter, nearly half of the city’s rental stock falls under the rent stabilization program, which caps rent increases. Rent stabilization remains in effect when the citywide housing vacancy rate is below 5%. But, because rent stabilization itself reduces vacancy and prevents densification, it helps to perpetuate itself. Thus, the government needs to incentivize new construction throughout the five boroughs so that the program melts away.
While I have discussed policies in other posts, the results here suggest a few more ideas. Upzonings in non-central neighborhoods need to be meaningful in that the increases in allowable FAR should be at least 25-30% more than what is currently built. There are thousands of pre-War five-story apartment buildings with built FARs between 4 and 5, while their allowable FARs are 4 or less. For these lots to provide more units, their allowable FARs need to be, say, in the 6 – 7 range, so that 10-story structures can rise in their place.
Furthermore, today there are about 175,000 detached single-family dwellings (23% of all residential structures)—each with one housing unit. If the zoning rules were changed to allow for accessory dwelling units (ADUs) or subdivisions to two-family homes, this could, in theory, double the housing provided by these units.
Lastly, the city needs to incentivize the merging of lots. One way to do this is to provide a zoning bonus based on the size of the combined lot. So, if a developer buys two adjacent lots and combines them, she will get additional floor area greater than the FAR of the individual lots (say the two lots each have a FAR of 3, the combined lot could have a FAR of 5).
The Future?
Two facts about Gotham are apparent. First, wholescale zoning reform has been off the table for six decades. Second, the city has a housing affordability problem. Though a thorough rethinking of the rules is needed—they were created when urban density was seen as an unmitigated disaster—we are going to have the current framework for some time to come.
Since this is the case, it is necessary to see how the zoning regulations are blocking new construction. Housing affordability will only become real when housing supply across the city outstrips demand. Changes in the zoning rules can help realize that reality.
Keep reading other posts on the history of the Floor Area Ratio and NYC Real Estate here.
—
[i] The debates about the rezoning of the Gowanus Canal and SoHo and NoHo neighborhoods show how fierce this debate can get.
[ii] To calculate the maximum population, I estimate the total residential floor area for 1961 and 2021 and then divide by 400 the average building space per person in the city.
[iii] I also ignore the possibility that developers can get FAR bonuses for providing plazas or other amenities. These bonuses tend to be allowed only in central districts with the greatest density.
[iv] I took the total residential floor area in 2021 and divided it by the population, which gave 400 square feet per capita. For simplicity, I assumed this number for 1961, which, from what I can tell, was probably about the same back then as well.
