Jason M. Barr September 29, 2025
Public housing remains a controversial subject. On the one hand, America’s government-owned and operated housing stock is widely viewed as worse than the privately owned housing it replaced. Yet today, with an affordability crisis raging across America’s cities, there are calls for governments to build “social housing,” a modern variant of public housing. Many Americans have found encouragement from the success of Vienna’s public housing, which represents over 20% its stock, and is seen as a potential model for U.S. cities. For that matter, 50% and 79% of residents in Hong Kong and Singapore, respectively, live in publicly produced housing.
So, which is it? Is public housing good or bad?
With this question in mind, this post reviews recent scholarship on public housing in the U.S. This review is in no way comprehensive but rather aims to give a flavor of how scholars continue to update and reevaluate the subject.
The Background
The germ of public housing dates to at least World War I. As historian Roy Lubove (1963) writes,
Acting through the Emergency Fleet Corporation of the U. S. Shipping Board, and the U. S. Housing Corporation, the government built or supervised the construction of several thousand dwellings for war workers and their families. The standards of community planning achieved through the war housing inspired a generation of architects and planners who hoped that similar standards might be applied in peacetime. War housing also encouraged the belief that government help was necessary for any long-range solution to the housing crisis which erupted following the armistice.
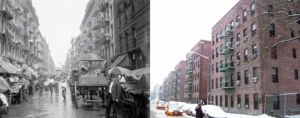
However, during the Roaring Twenties’ building boom, public housing advocates were largely muted. Cheap working-class housing was constructed in massive quantities on the urban fringes, as streetcars or subways provided easier access to higher-quality units in leafier environs. The restrictions on European immigration also meant less pressure on inner city housing. “Slums” like the Lower East Side were clearing out, though the Harlem Renaissance was also accompanied by a Harlem housing crunch.
Early Seeds
However, when the Great Depression hit, public housing advocates gained center stage, particularly within the Roosevelt Administration. The earliest seeds of public housing, however, began in New York under Mayor Fiorello LaGuardia’s leadership (in collaboration with the Roosevelt Administration). He spearheaded the formation of the New York City Housing Authority (NYCHA) in 1934, which had built 2,200 units by 1937, the year the first Federal Housing Act was passed. However, the real push for public housing began in 1949, when the Housing Act was amended, and the construction race was on.
Sweet to Sour
However, things began to go sour quickly. The combined effect of concentrated poverty and the inability of local officials to maintain their assets led to a loss of faith in the program. Between 1972 and 1976, Pruitt-Igoe, the housing project in St. Louis, was demolished. As the buildings imploded from the dynamite, so did the dreams of the reformers.
In 1973, President Nixon placed a moratorium on new construction, effectively halting any future projects. Then, in 1992, President Clinton introduced the Hope VI program, designed to encourage the replacement of high-rise projects with mixed-use, mixed-income developments and a greater uptake of housing vouchers.
Nonetheless, today there are some 3,300 local public housing authorities around the country operating nearly 900,000 units. NYCHA is the largest public housing authority (if not landlord) in the country, owning some 161,000 apartments on 277 sites.
The Projects
Despite public housing being a 20th-century concept, research on the topic remains a vibrant cottage industry. Scholars have looked back and made more systematic re-evaluations. The result is a more complex and nuanced picture.
The latest work on public housing in the U.S. is a book by Howard Husock, The Projects: A New History of Public Housing (NYU Press, 2025), released this month. Husock is a senior fellow in Domestic Policy Studies at the American Enterprise Institute (AEI). The Projects is a follow-up to his book, The Poor Side of Town: And Why We Need It, where he forcefully advocates for the return of private-market, missing middle housing, such as the triple-deckers of Boston, that allowed cities to (affordably) grow in the 20th century.
In The Projects, Husock provides a concise overview of the history and impacts of public housing. His overall assessment, however, is negative—that the costs of public housing to America’s cities and residents outweighed its benefits.
As Husock writes,
Public housing’s litany of social ills and management problems today obscure the public-spirted idealism bordering on utopian that ushered public housing into American life….This book differs from previous histories of public housing, in that it will focus less on approaches that might have or might still make public housing ‘work.’ It, rather, emphasizes the intellectual origins of the movement, including the writings of key Depression-era writers, emphasizing that there was little grassroots or political demand for public housing construction but that it was, rather, elite led.
Husock’s documents that public housing was driven by starry-eyed reformers who were so determined to eradicate the slums that they did not stop to consider whether what they were doing was, in fact, in the best interests of residents (or the cities) they sought to help. The construction of public housing was primarily undertaken without the participation or consent of those living on the blocks where the housing was built, and without recognizing that neighborhoods are complex ecosystems of housing, jobs, institutions, businesses, and so on.
A Neighborhood Replacement Program
Public Housing was, from the start, a neighborhood replacement program. It was not a pure “supply side” program in the sense that the government decided to provide housing in parallel to the private market, but instead was meant to demonstrate how the free market’s failures to provide safe, clean, and affordable neighborhoods could be replaced by government-created ones.
Reformers, however, soon discovered there was no such thing as a free lunch. They couldn’t engineer their dreams without introducing new, unanticipated problems. On the one hand, the projects had “to pay”—to generate enough income to keep themselves afloat, but on the other hand, their mission was to house people who could not otherwise afford decent shelter. Given the apparently unreconcilable tension between generating revenue and being the “shelterer” of last resort, most local housing authorities found themselves unable to make to their projects succeed.
In the end, Husock laments that cities would have benefited more from what the late Senator Daniel Patrick Moynihem termed “benign neglect.”
Public Housing that Worked
Yet not all research on public housing takes a negative view. Arguably, Hunter College Planning Professor Nicholas Dagen Bloom takes a more controversial position in his book, Public Housing That Worked: New York in the Twentieth Century (UPenn Press, 2008). Here, Professor Bloom makes a straightforward argument: New York City’s public housing, while still suffering from many of the problems that plagued The Projects in other cities, has achieved an enduring legacy of providing affordable housing that is reasonably well-maintained and operated.
New York built its public housing within a tradition of having a large private multifamily and high-rise housing stock. As the subway expanded into the Bronx and Brooklyn in the early 20th century, new middle-income high-rises emerged in these areas. Massive housing developments built after the start of the Great Depression provided further models.
For example, the developer Fred French completed Knickerbocker Village in 1933 in the Lower East Side, which included twelve 13-story buildings surrounded by a courtyard. During and after World War II, MetLife built communities such as Parkchester (1942) in the Bronx, with 171 buildings of 8 or 13 stories, and, with help from Robert Moses, Stuyvesant Town and Peter Cooper Village (1947) in Manhattan with 110 high-rises. They were tower-in-the-park projects specially designed for high-rise living for working-class families, and they remain desirable places to live.
The key to the public housing that worked, Bloom argues, was that NYCHA could draw on the city’s high-rise management experience. This fact, combined with NYCHA’s hiring of a more professional (and uncorrupt) workforce, meant that the stock of public housing and its grounds would be relatively well-maintained. It would not face the same problems as St. Louis or Chicago, whose Projects were left to rot.
The Bronx That Did Not Burn
When arsonists destroyed the Bronx low-income housing stock in the 1970s, public housing remained untouched by the conflagrations. As Professor Daniel Immerwahr writes in The New Yorker, “And although urban unrest had often burst forth from public-housing developments, the projects in the Bronx were virtually flameproof. As a report from the Bronx District Attorney’s office observed, the New York City Housing Authority provided residences for 169,663 families as of January, 1977, yet saw an ‘almost total absence of fires.’”
Public Housing has also worked, in hindsight, because of New York’s renaissance since the 1990s, when jobs returned and economic growth ratcheted up. As housing has become increasingly unaffordable, public housing is often the last refuge of affordability for many low-income New Yorkers. The waiting list for NYCHA housing contains approximately 241,000 households.
City Economics
Professor Brendan O’Flaherty of Columbia University discusses the economics of public housing in his 2005 textbook, City Economics. It’s well worth quoting him at length. First, he reviews the relative benefits, writing,
Although U.S. public housing has been unpopular as a policy for many years, it has accomplished several important goals. First, many poor people have had better housing and better lives than they otherwise would have. Housing authorities provide something poor people want, and even the most troubled LHAs [Local Housing Authorities] have long waiting lists. Public housing sometimes makes adults into better parents and often improves its residents’ health.
These conclusions arise from a variety of studies.… Currie and Yelowitz (2000) find that in the early 1990s, everything else being equal, families that lived in public housing projects were less likely to suffer from overcrowding. Children who lived in housing projects also did better in school than otherwise similar nonproject children; boys especially were less likely to have been held back in school.
Newman and Harkness (2002) look at a longer time frame—they ask whether teenagers who lived in housing projects in the 1970s were more successful in their midtwenties than otherwise similar kids who did not. Their answer is a mild yes: growing up in a project made them more likely to avoid welfare dependency and possibly more likely to earn a good wage and stay out of poverty.
(Notice that these studies ask and try to answer a difficult question, but the right question. No study maintains that children from projects do better in school or make more money than children who are not from projects. They don’t. But the reason they don’t is that they come from families that are poor and have many problems. The question is whether children from poor, multiproblem families who live in housing projects do better than children from poor, multiproblem families who don’t, and the answer is yes.)
Location and Design Choices
Nonetheless, from his perspective, public housing is problematic. First, the government had to make decisions about the location of projects. As he states,
It’s hard to see how governments can get the location question right, and easy to see how they can get it wrong. In a perfect land market, a profit-maximizing apartment operator commissioned to build a building for poor people will choose the right location: he will get the benefits of a better location in the form of higher rents his tenants will be willing to pay and lower construction expenses, and will bear the costs of the inconvenience his location imposes on other people by paying the price of land. These incentives to build in the right places disappear when the rents that an LHA collects have little or nothing to do with what tenants are willing to pay, as in U.S. public housing.
The result of this economic problem was a massive mismatch between where job opportunities were growing (in the suburbs and out west) and where the cheap housing was being built (in the inner-city neighborhoods of the Rust Belt). This spatial mismatch exacerbated the problems in The Projects. The lure of cheap housing (along with welfare payments) kept people in the cities that had fewer opportunities for employment and economic mobility.
On their design, he writes,
Since most of public housing before urban renewal had been low-rise (three-story buildings being predominant), new high-rise construction for poor people introduced still another new form of housing never before seen in the market. Before this, high-rise apartments had only been for middleclass and rich people—they traded off low privacy and the expense of elevators and reinforced structural supports for great access, great locations, great views, or amenities like doormen. Architects of public housing high-rises had to include all the bad features of high-rise living (including severely restricted elevator access) and leave out all the good, as they tried to invent a new form of housing.
The result of this bizarre history is an architecture almost universally reviled. In many cities the high-rises built in this period have since been depopulated and blown up. The Pruitt-Igoe housing project in St. Louis was the first to go, in 1976, but high-rise projects in Newark, New Orleans, Boston, Chicago, and several other cities have also been knocked down.
Recent Economics Research
Recent work has focused on the spillover impacts of public housing on the surrounding communities. One working paper, “Public Housing Preferences: Evidence from New York City 1930-2010 (2025)” by Dr. Maximilian Guennewig-Moenert of the University of Cologne, looks at long-run economic indicators in census tracts and surrounding ones that had public housing in New York. The idea is to compare census tracts in and around the projects to those a bit further away. These “further away” tracts offer a useful control group to see how neighborhood demographics and rents would have unfolded if public housing had not been constructed.
First, Dr. Guennewig-Moenert finds that public housing drove a general loss of neighborhood populations. He writes,
Crucially, by separating public housing residents from the rest of the population, I am able to identify market-driven responses among private households. I find that the number of privately housed White and Black residents declined by 49.2% and 36.9% within 10 years, and by 87.9% and 75.9% over the long run—corresponding to net losses of approximately 2,997 White and 1,141 Black residents per tract.
In short, there was both white and black flight in the census tracts with public housing, but relatively more black families were placed in public housing, thus the net loss of black residents from these tracts were lower. This finding also suggests that by building public housing, NYCHA was generating higher racial segregation across the city.
Additionally, he concludes,
[P]opulation shifts were accompanied by substantial declines in local rents. Median contract rents fell by 42.7% over 60 years. I find similarly sharp declines in market rents, using rental listings from the New York Times: median and average rent per room declined by 67.8% and 75.0%, respectively. Taken together, the concurrent decline in rents and the out-migration of privately housed residents provide evidence that public housing construction reshaped the desirability [for the worse] of the surrounding neighborhoods in the private market.
However, he does find the interesting result that the post-1970 housing projects were less associated with flight from their respective neighborhoods. Evidently, these projects tended to be low- and medium-rise buildings, and thus residents on surrounding blocks were less put off by their architecture.
In short, he finds that public housing projects accelerated white flight and caused residents to perceive a loss of neighborhood quality (which might be due to ugly architecture or more crime, for example), though this impact seemed to moderate after 1970.
Post-Public Housing in Chicago
If building public housing had unintended consequences, then so can removing it, as detailed in a published study entitled, “Pecuniary Effects of Public Housing Demolitions: Evidence from Chicago” (2023) by Professor Hector Blanco of Rutgers University.
As Professor Blanco writes, “Chicago … accounted for one-fifth of all public housing units demolished nationwide between 1995 and 2010 (22,703 units). Furthermore, only around one-third of demolished units were eventually rebuilt, less than a half of which were public housing.”
By comparing census tracts around the demolished projects to “matched” census tracts further away, he was able to compare housing price trajectories in the “treated” tracts (i.e., those next to the demolished projects) to those that were quite similar in economic and demographic composition, but which did not experience the demolitions. He concludes that “house prices increased by up to 20 percent over a ten-year period in census tracts near the demolitions.”
Diminished affordability emerged through two distinct processes. The first is that by removing the public housing units, tenants had to find new housing nearby, driving up prices. And second, by eliminating The Projects, these neighborhoods were now ripe for gentrification, further increasing housing costs.
In short, removing public housing without providing a one-for-one replacement in the neighborhood and not accounting for gentrification led to the unintended consequence of making housing less affordable for residents.
The Future of Public Housing
So, what does this research suggest about the future of public housing in the United States?
Well, on the one hand, the era of slum clearance is clearly over. The Projects were borne from the idea that urban density was bad and needed to be checked, if not eliminated. But today density is hip—it drives a host of urban benefits, including higher worker productivity and access to more local amenities. However, the renewed interest in dense urban living is putting pressure on housing prices and some forms of public housing are being given a second (or renewed) look.
NYCHA
In New York, the future of the public housing projects is hopeful. As many cities continue to diminish their public housing footprints, New York’s stock is being given an upgrade. NYCHA is taking a two-pronged approach. One program aims to convert 62,000 units to public-private partnerships by 2028, in which NYCHA will continue to own the developments while selling a 99-year lease to private companies or nonprofits to effectuate repairs and a take control of daily operations.
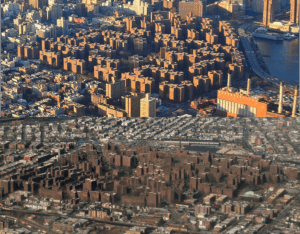
Additionally, ironically, the post-World War II preference for designing tower-in-the-park developments has become an asset to NYCHA, which controls vast acres of underutilized land. Excess land will now be sold to private market developers for private housing. The revenues from these sales will be used for capital improvement in the public housing buildings.
If New York succeeds, it can become a model for other cities.
Social Housing
Today, there are renewed calls for “social housing,” which includes new housing built and owned by the government. However, given the failures of public housing, can social housing work?
The short answer is yes, but only to a degree. Those who now build affordable housing using government programs like the Low Income Housing Tax Credit (LIHTC) and other subsidies can and have built apartments that are affordable over the long run. So, it is feasible.
But, to make social housing a sustainable program, it needs to consider the bottom line. Tenants need to have a variety of incomes so that higher-income households subsidize those with lower income. Money must be set aside for upgrades and capital improvements. But long-term subsidies are generally required to make these projects work.
Social Housing Won’t be Enough
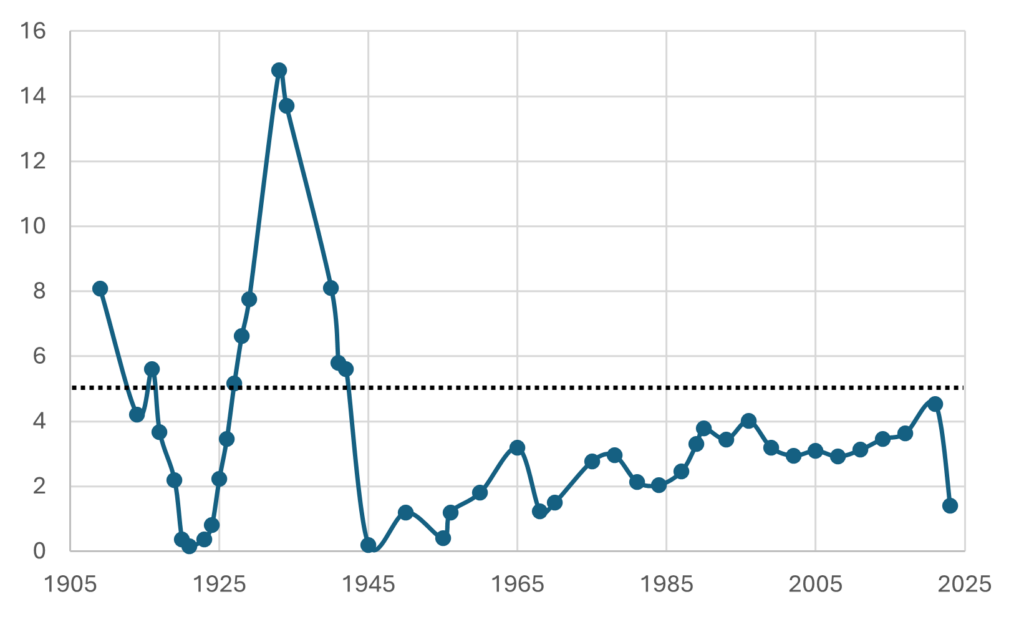
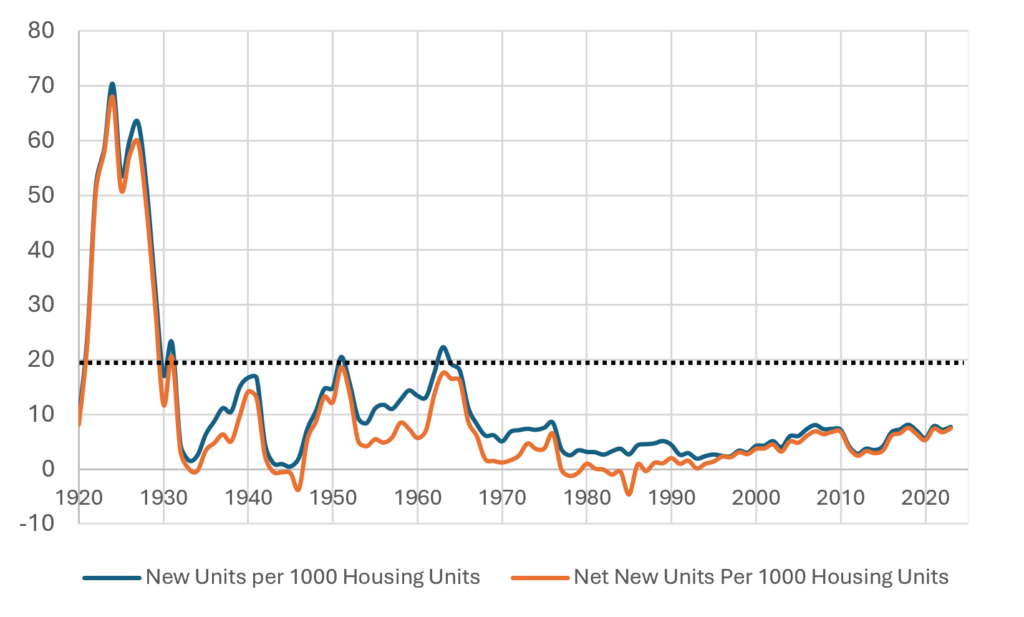
The fundamental issue, however, is whether the public sector can build (and pay for) enough social housing to make a broad dent on affordability. The answer is most likely no. New York, for example, currently builds about 25,000 housing units per year, on average. By my estimates, Gotham would need to construct 50,000 per year for a decade to truly make a dent in affordability.
Thus, social housing, although useful if it adds units, would not be sufficient. The private market would need to pick up the rest of the deficit. In addition, social housing creates a pool of winners and losers—those lucky enough to win the social housing lottery get a benefit that others don’t get. And if history is any guide, this can engender resentment. Historically, affordable housing emerges through the filtering process, where aging middle-class housing because cheaper. Thus, the best way to help low-income residents is to flood the “missing middle” of the housing market.
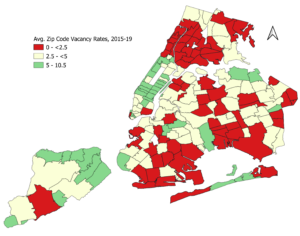
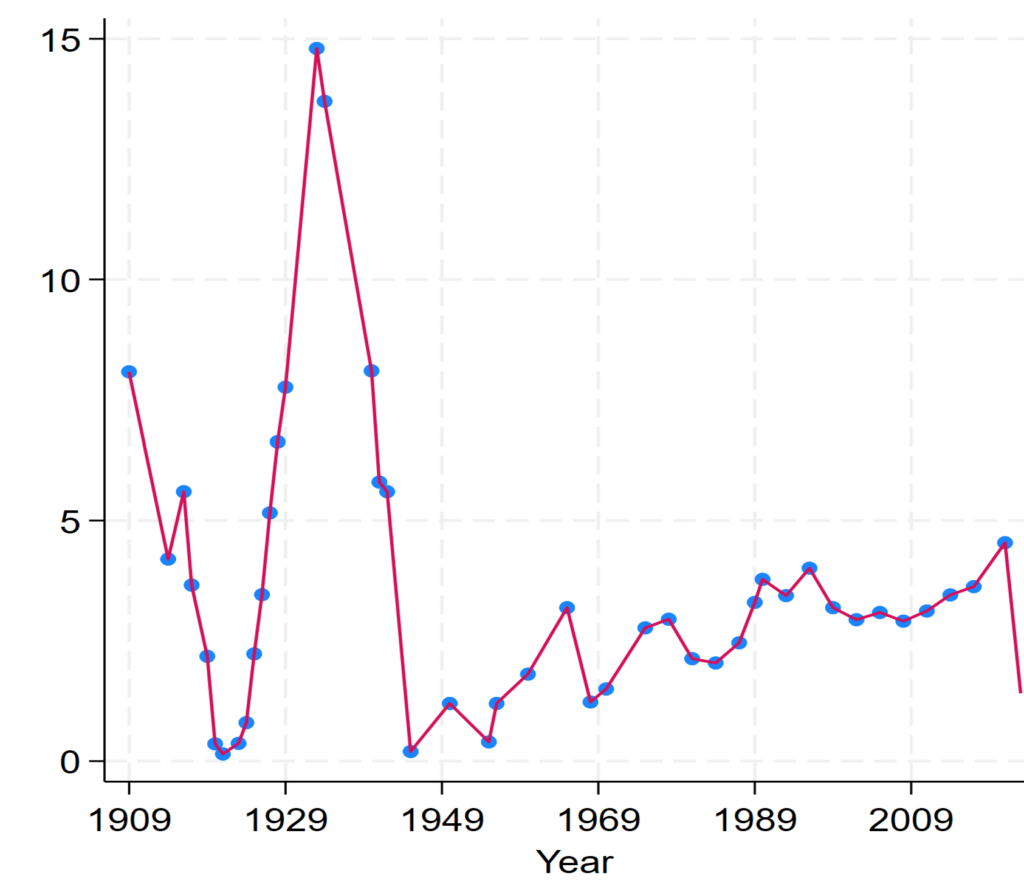
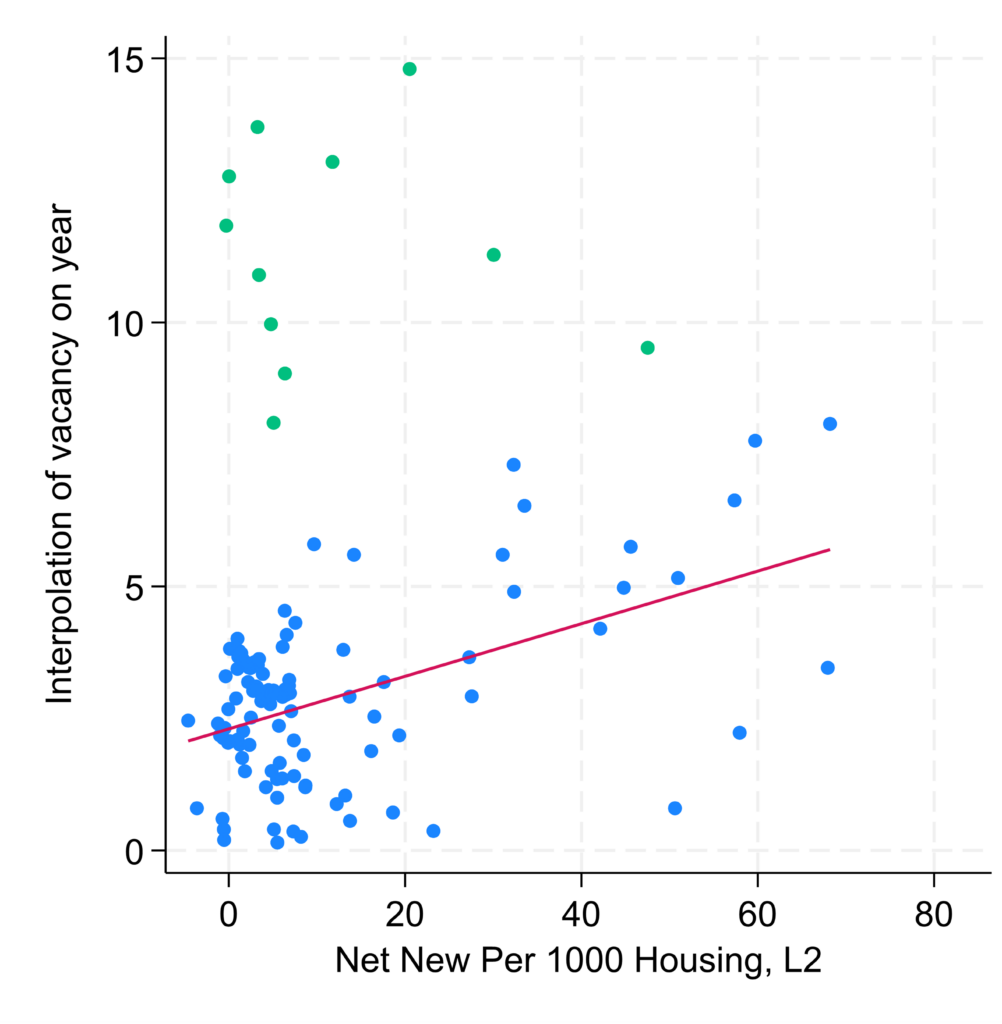
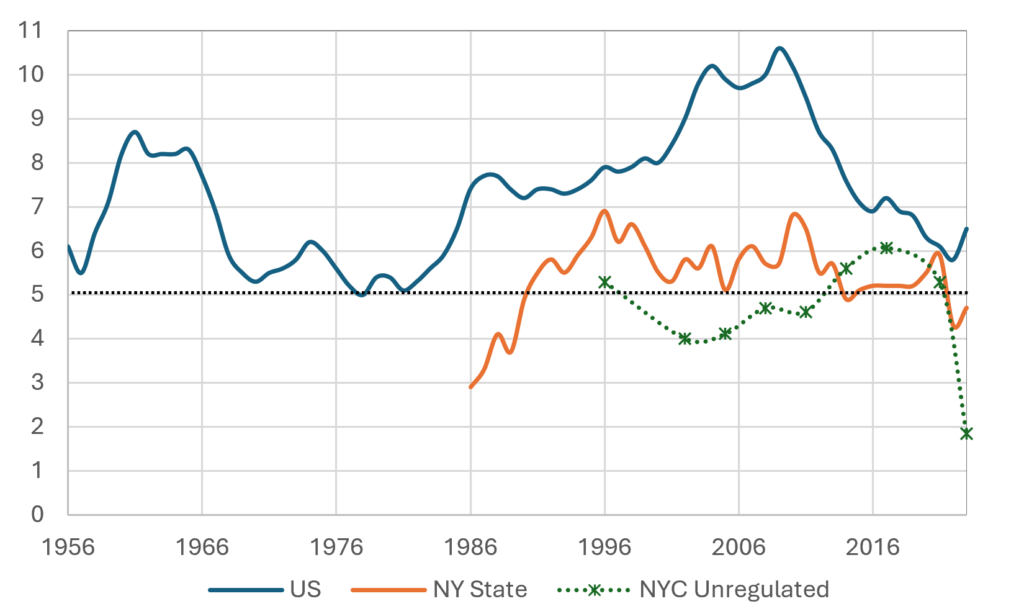
The affordability crisis comes from the low vacancy rates of middle- and low-income housing. Cities should therefore target vacancy rates to make sure they are systematically above 5%. Targeting requires massive upzonings in middle- and low-income neighborhoods and subsidies (or regulatory barrier reductions) to reduce construction costs, with supplemental government-produced or initiated housing.
The Land Authority
Rather than directly involving itself in the production and ownership of housing, a more efficient strategy would be the formation of a Land Authority. The idea is that this local authority buys up large, underutilized lots, clears the land, master plans the site (and it’s best if the Authority is not bound to overly restrictive local zoning), adds any necessary infrastructure, and then sells 99-year ground leases to private developers. The ground leases would state the number of units that must remain affordable. By having a Land Authority, a city or state can ensure new housing is built where it is most needed and can help keep neighborhood rents in check. But again, to have a dent in prices, the Land Authority would need to add large quantities of housing in working-class neighborhoods.
It’s a Supply Problem
The real problem today is not free-market housing versus government provided housing. It’s housing supply. Over the decades, tighter regulations and building codes, and zoning restrictions, implemented in the name of improving housing and neighborhood quality, have created a situation where cities simply cannot build enough to keep up with the demand. Middle- and working-class housing has basically been regulated out of existence.
Thus the real lesson of public housing in the 20th century is not that the government shouldn’t be providing housing at all, but rather it should be building it along side of the free market and in neighborhoods where middle- and lower-income housing is sorely needed. Public housing can help maintain neighborhood diversity and allow for those impacted by gentrification to have some assurance they won’t be displaced. But at the end of day, we need to make housing abundant for everyone. The best role of government therefore is to incentivize abundance broadly, with public housing as one weapon within the abundance arsenal.