Jason M. Barr June 16, 2020
Pandemic 2020
On March 11, 2020, the World Health Organization officially declared the COVID-19 outbreak a pandemic. The first case appeared in Wuhan, China, on December 31, 2019. It arrived in the United States toward the end of January. On March 1, the New York metropolitan region saw its initial infection, and soon after, it became one of the world’s epicenters.
The general response by governors across the country was to close businesses, schools, and other public institutions, and send everyone home to “shelter in place.” While the epidemic in New York is far from over, isolation policies have worked to the degree that the region can begin to reopen. Arguably, the reason that the coronavirus requires a swift and forceful policy of social distancing is that not only can the infection cause terrible illnesses, but is also frequently fatal, either from the virus itself or a secondary disease, such as pneumonia. A recent study estimated that as many as 13 people out 1,000 infected are killed by it (compared to 1 in 1,000 for influenza), though that estimate is likely on the high end.
But this raises the question of how bad has the COVID-19 epidemic been in terms of mortality rates for dense cities like New York? In many respects, the history of cities is the history of the ebb and flow of shocks to our health and well-being. Here, we review over two centuries of mortality rates in New York City to not only place COVID-19 in context but also to see how the nature of mortality has evolved. To do this, we separate mortality rates into two parts. First is to look at the baseline or trend rates, and second is to review the so-called excess death rates–those years in which deaths were unusually high relative to the norm. How does the increase in deaths from COVID-19 compare to other big epidemics of the past like the 1918 influenza outbreak or the frequent smallpox epidemics of the 19th century?
Our Urban History
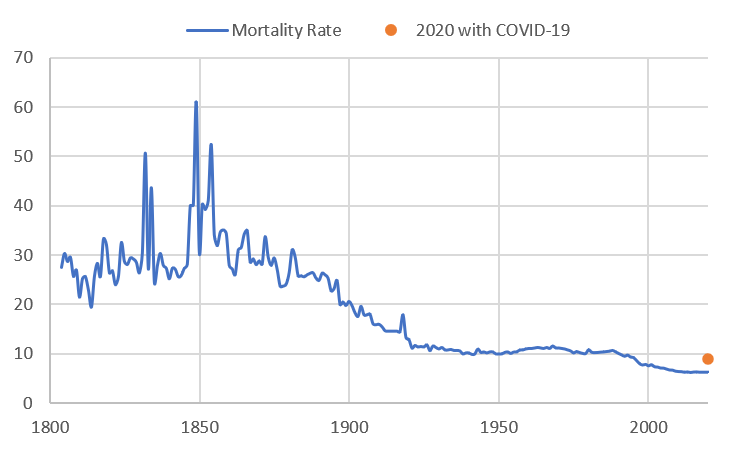
Taking this long-run view allows us to draw some conclusions. First, there is a complex relationship between density and mortality. Just because a place is dense does not mean it automatically has a higher death rate. Manhattan’s death rate peaked in 1849, yet its population continued to rise until 1910. New York City’s death rate has steadily fallen over the last 170 years (data sources are here).
Second, the city is far healthier today than it has ever been in its 400-year history. Before the coronavirus came along, one could argue that it was experiencing a kind of golden age of low mortality. And while COVID-19 is likely to increase the number of deaths in New York by over 40% as compared to last year, ironically, the death rate for the city will be as it was in 1995.
Third, despite dire predictions of the COVID-19 epidemic destroying the city, a long-run view suggests this conclusion is premature. New York, over the centuries, has weathered many, many epidemics. Though the suffering they cause is devastating, the city has not only survived but has also become stronger as a result. The seeds of tragedy plant the flowers for a better, healthier place. Horrible events are met by collective action that improves the human condition (though frequently more slowly than it should). While this may be small comfort to those harmed, it should help us, as a society, feel more confident about our cities.
Lastly, just as land values can be an indicator of the health of a city’s real estate and economy, mortality rates can be an indicator of the health and well-being of its residents. Constant advances in technology, scientific knowledge, and medical treatments generate improvements in the quality of life. On the other hand, because of random shocks (outbreaks of disease or terrorism) or ongoing urban problems (such as crime, poverty, or failures in governance), these forces drag down health and increase mortality. As a result, the history of mortality is like a horse race between the “good” and the “bad.” When mortality rates are rising, or even flat, it means urban problems are occurring at a rate that, on average, offsets the improvements. When mortality is falling, it means that the advances are winning. In the very long run, the improvements have (and will) carry the day.
Mortality since 1800: A Helicopter View
Before we proceed, however, one caveat is in order. The focus here is on gross mortality rates: the number of deaths per 1,000 residents. It is admittedly an overly broad indicator. Different groups, of course, have different mortality rates, such poor versus rich, and infants and the elderly compared to young adults, and so on.[1] A more comprehensive history would need to detail how the less-advantaged groups have fared over time. The quality of a society can be measured by the health of those with the fewest resources. Nonetheless, gross mortality rates can help tell the story of a city’s health and history.
Looking at the broad sweep of mortality in New York City shows, roughly speaking, five major periods. Period I is from about 1800 to 1860. This was a time of rapid urban growth alongside frequent and devastating epidemics (as will be discussed in more detail below), with death rates peaking before the Civil War. Period II is from about 1860 to 1890. This time can be called post-peak mortality, where death rates fell over the period returning to a level that was not seen until the early 1800s. Period III, from about 1890 to 1925, is the Mortality Transition, as mortality rates steadily declined, and converged to those of the United States as a whole.
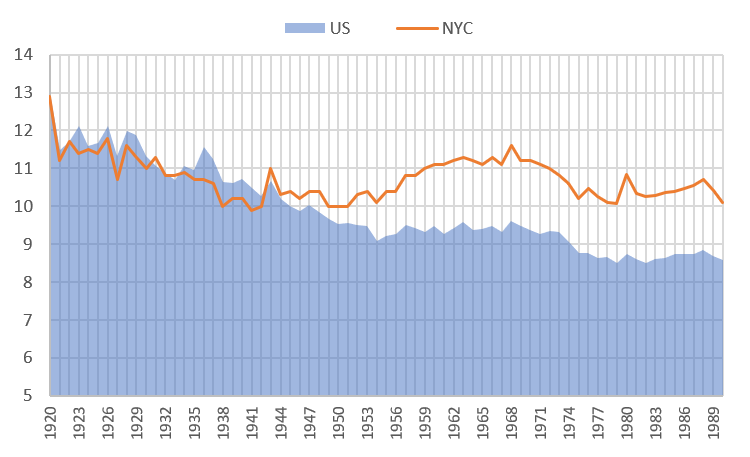
Period IV, from 1925 to 1990, is what might be called net-zero mortality—two sets of forces were working at odds—improved health and medical care were fighting against ongoing urban problems, such as air pollution, crime, and unemployment. While death rates for the city stayed in a limited band, they began to diverge from the United States, which saw declining mortality. Period V started around 1990, after the crack cocaine epidemic passed, and crime rates began to decrease.[2] The death rate in New York City dropped to a new low level. This is where we were when COVID-19 came along. In fact, starting in 1996, New York’s mortality rate has been lower than that of the United States. Pretty good for a city that was (proverbially speaking) told by President Gerald Ford in 1976 to “drop dead.”
The Epidemic Century
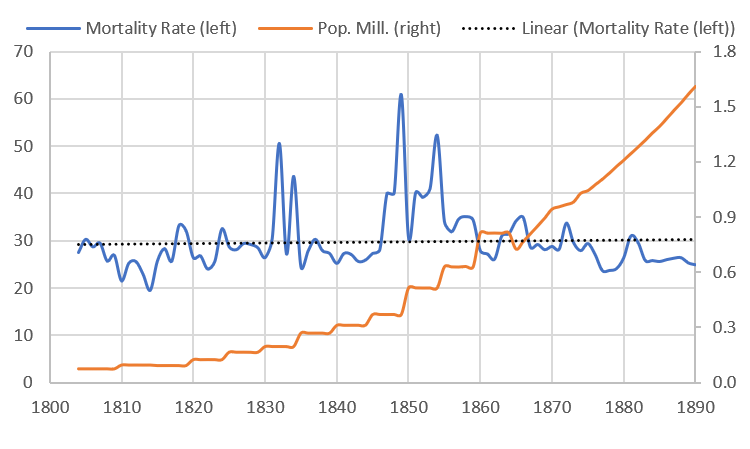
From at least 1791 to 1900, New York City experienced frequent and devastating epidemics.[3] One can even say that epidemics were a regular part of life. The “normal” baseline death rate in New York City, in a good year, in the first half of the 19th century was between 25 and 30 deaths per 1,000 residents. But constant epidemics continually moved the city above that rate. Epidemics often doubled the death rates above the baselines. Between 1804 and 1887, there were at least 25 epidemics, for an average of one every three years. In fact, in the years 1834, 1849, 1851, 1854, 1864-1865, and 1872, two epidemics were occurring at the same time.
The Diseases
By far, up until 1875, the most frequently recurring epidemic was from smallpox. This is ironic since a vaccine was known since the early 1700s. Yet it did not entirely disappear from the city until after 1902 (though a brief resurgence came in 1947). Two diseases tied for second, in terms of frequency: typhoid/typhus fever, and cholera. Typhoid/typhus fever was transmitted through contaminated food and water, and from direct contact with the infected. Cholera was also spread by contaminated food and water. Additionally, Yellow fever was a regularly appearing epidemic, which first arrived in New York in 1791 and disappeared after 1822. It was transmitted by mosquitoes, which likely spawned in the marshes and still waters of the island.
Arguably, the worst year for the city was 1849 (just at the height of immigration from the Irish Potato Famine) when over 5,000 people died of cholera, and the death rate spiked to 60 deaths per 1,000 residents. The additional deaths from cholera, if scaled up to today’s population count, would amount to the equivalent of about 95,000 additional deaths in 2019! And, in the three years from 1847 to 1849, there were some 8,000 reported deaths from typhoid, cholera, and smallpox combined.
Panic in the City
The random emergence of the epidemics caused the same kind of panics then as we see with coronavirus today. As one scholar writes about the 1832 cholera outbreak,
On Sunday, July 2, despite a calculated official silence, the existence of the first cases of cholera in the city was an open secret. Mass exodus from the city had already begun. To those able, flight was the immediate and traditional reaction. A hyperbolic and sarcastic observer remarked later that on Sunday “fifty thousand stout-hearted … New Yorkers scampered away in steamboats, stages, carts, and wheel barrows.” Farm houses and country homes within a thirty mile radius of the city were filled.
The feeling of dread was a common element of city life, as historical demographer, Gretchen Condran, writes,
Cholera and yellow fever defined the practical and emotional meaning of epidemics during the late eighteen and early nineteenth centuries. Virtually no deaths from these two diseases were recorded in the nonepidemic years. They arrived suddenly, ran their course in a matter of months, and then returned some years later with little or no warning….That a person could be well in the morning and dead before nightfall, a stark contrast to the lingering illness associated with many epidemic diseases like tuberculosis, added to the fear and panic that accompanied these epidemic diseases.
Was Density to Blame?
While I will have more to say about the role of urban density and epidemics in a future post, suffice it to say, the relationship between population density and the severity of epidemics is not so simple. Dense tenement districts were often hot spots for the epidemics, and the poor disproportionately suffered more than the rich, many of whom fled the city during the crises.
But over time, diseases like yellow fever and cholera would largely be eliminated, even as the tenement districts became more crowded. While poor hygiene and lack of sanitation were part of the problem, so was the city-wide environment. New York City, then as today, was a great hub of economic activity, and it was mainly through the port that diseases would enter and spread.
At the time, when germ theory was still not largely understood, health officials assigned blame for these diseases on many factors that seem strange to us today. There were also moral dimensions to their assessment—the poor immigrants huddled together in their dank, dirty tenements were responsible for these diseases because of their poor characters. Or as stated in an 1865 report by the Association for Improving the Condition of the Poor in New York (likely referring to the Irish),
[L]arge masses of the population are debased by the wretched condition in which they are compelled to live. These conditions should be improved; still, it would be true of many thousands, that if left to the uncontrolled indulgence of their reckless, filthy habits, they would convert a palace into a pigsty, and create “fever-nests” and hotbeds of vice and corruption, under circumstances most favorable to health, comfort, and social elevation.
The Mortality Transition
Starting around 1890 or so, the regularly occurring epidemics became less devastating. This is not to say the city was free of epidemics, but those that did occur killed proportionally fewer people. And overall, by the late 1880s, the death rate in New York City began to fall quickly. In 1890, there were 25 deaths per 1,000 residents. By 1925, it was more than half of that at 11.4.
The reasons for the mortality transitions were many. First, scientific knowledge of germ theory helped people better understand and prevent the spread of diseases. In the second half of the 19th century, New York City expanded its water and sewerage system, which, over time, became universal. Housing reforms cracked down on excessive crowding and unhealthy living conditions. Mass transportation investments and rising incomes allowed people to live further away from the city center and have more housing.
Flatlining
But starting in the 1920s and up until around 1990, mortality rates in New York remained steady, between 10 and 12 deaths per 1,000 residents. What is particularly noteworthy is that mortality rates declined faster in the U.S. than in New York City. However, New York was suffering from a series of problems that were counteracting improvements overall. The effect was a kind of net-zero for gross mortality rates—improvements and problems were offsetting each other. From 1955 to 1970, mortality rates in the city were, in fact, increasing, even while they were falling throughout the rest of the country.
New York, during its industrial heyday, was a very polluted and congested place. Starting in the late 1960s, the city’s industrial base began to disappear, putting many low- and middle-class people out of work. Racial problems intensified as cities throughout the U.S. saw the rise of so-called black ghettos, marked by hyper-segregation and concentrations of poverty, crime, and drugs. In 1975, the government was on the verge of bankruptcy and was forced to reduce services that protected the public. City problems were killing people faster than medical improvements could keep them alive.
The Role of Homicides
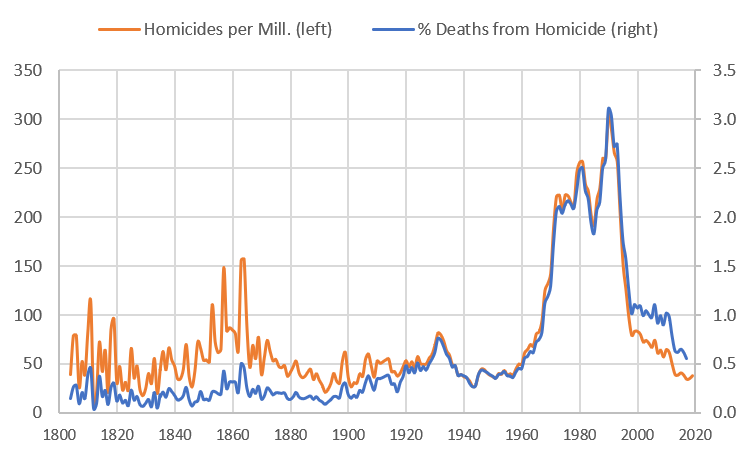
New York City has always had to deal with violent crime and homicide. Here we take a brief detour to look at the long-run role of homicide in influencing mortality rates. The conclusion from this analysis is that homicides have always represented a small fraction of the total number of deaths, even in the most violent years. In the 1970s and 1980s, homicides accounted for between 2-3% of total deaths (which, of course, is still too many). In 2019, murder rates were as low as they have been since the 19th-century. Before the modern period, the Civil War era was particularly violent, especially during the Draft Riots of 1863. Though the official figure was that 119 people killed, estimates of the actual number is as high as 1,200.
A New Hope: Since 1990
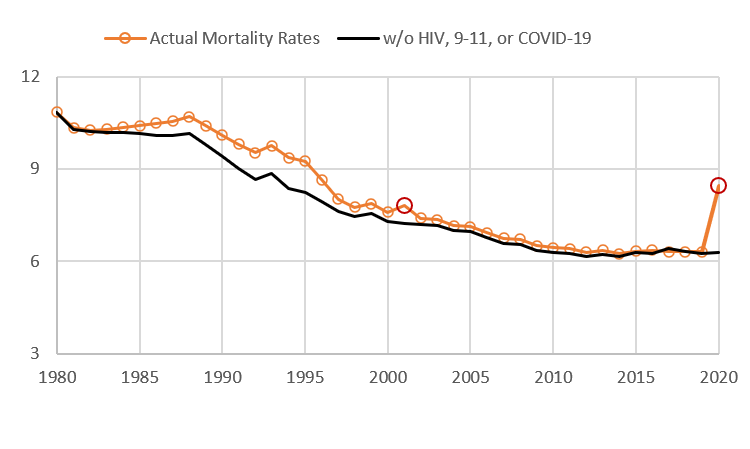
And then, perhaps unexpectedly, death rates in New York City began to decline. In 1990, mortality rates were about 10.1 people per 1,000 residents. By 2019, they were down to around 6.3, a reduction of over 37%. Many of the urban problems that plagued the city started to dissipate. Crime rates began to plunge, and the internet and telecommunication revolution created new employment sectors. New York City experienced a renaissance, and its residents were healthier as a result. Aside from the HIV/AIDS crisis (and some severe influenza outbreaks in 1957 and 1968), there has not been an epidemic in the city since 1918. However, between 1983 and 2017, some 83,000 New Yorkers died from HIV. In the worst years of 1994 and 1995, HIV-related deaths increased the mortality rate by 11% above baseline.
As of this writing, New York City has seen 17,351 confirmed COVD-19 deaths and another 4,692 probable deaths. The city will likely end the year with a mortality rate of around 9.0, which was last seen 25 years ago. As a comparison, the Spanish Flu Epidemic of 1918 increased the number deaths in the city by 25% as compared to the year before. To date, the coronavirus has increased the number of deaths by 42% versus 2019. So the COVID-19 epidemic will likely be worse than the 1918 flu epidemic, but not as bad as those that occurred before the Civil War.
The Future
Nonetheless, if there is one conclusion that emerges from the long run analysis is that all epidemics that hit the city were eventually banished. Sometimes, however, they took a while to be eliminated, but they were eliminated. Today, it is hard to feel and understand what diseases like yellow fever, cholera, and typhoid fever did to the people of the city, since their impacts happened so long ago. However, likely each one generated fear and panic and instilled a sense of impending doom. But the idea of New York City, as a home for strivers, as a vibrant center of culture and life will persist. It is this idea that moves us to solve our problems and will oneday return New York City back to us.
Thanks to Troy Tassier for helpful comments.
—
[1] There is also another important issue to consider, namely that of measurement. The mortality rate is defined as the number of deaths per 1,000 residents. This is possibly problematic on two fronts. First, we don’t know the actual number of deaths in a given year, since reported deaths almost surely undercount the true numbers. Second, population counts also need to be approximately accurate. There’s not much that can be done on this front, but likely, today, measurements for both figures are more accurate and so, if anything, the under counts of deaths was much higher in the 19th century, which would suggest even larger improvements in health and well-being than indicated by the official data. However, the problem with measuring COVID-19 deaths brings to light the problem of measuring death counts during epidemics.
[2] The HIV/AIDs crises began in 1983. Deaths peaked in 1995 and steeply dropped until 2000. Since then, deaths from HIV have steadily declined.
[3] Until 1874, New York City was Manhattan. After that, the city annexed the western parts of the Bronx. In 1898, the city then annexed the rest of the Bronx, Queens, Brooklyn, and Staten Island. Here death rates until 1900 are given for Manhattan; from 1901 to the present, death rates are for the entire city.